Dashboard
Increased Dashboard Tile Limit
You can now include more content in your dashboards with an increased total tile limit of 50. This enhancement allows you to build more comprehensive visualizations and consolidate critical data into a single view for better monitoring and analysis. While the overall capacity has expanded, metric tiles using combo visualizations will maintain the existing limit of 28 to ensure optimal performance and readability for that specific tile type.
See Dashboard Tile Limitations for more details.
Enhanced List Visualization for Metric Tile
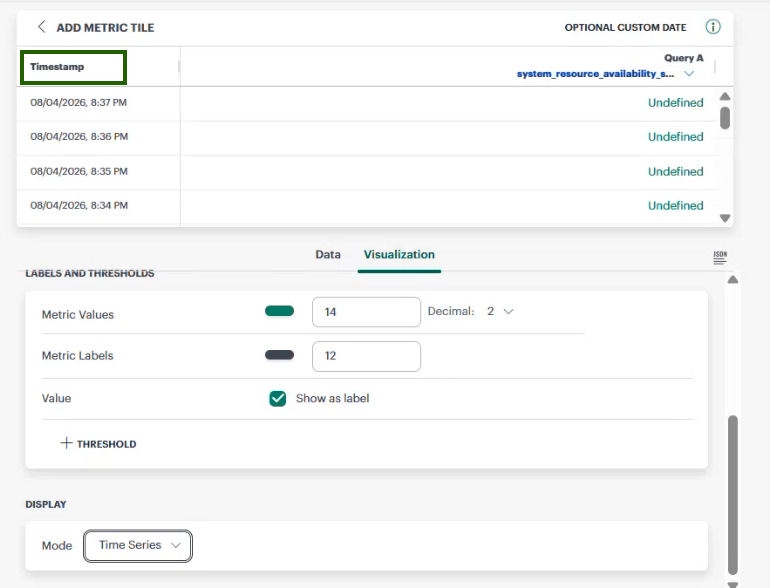
The List visualization in metric tiles now displays metric values across the selected time range instead of showing only the latest value. Each timestamp is displayed in a separate row, making it easier to analyze historical trends directly within the tile. When a query returns multiple data series, you can use the column header dropdown to select and view the specific series relevant to your analysis.
See Metric Tile for more details.
Increased Query Limit for Line and Bar Visualizations in Metric Tile
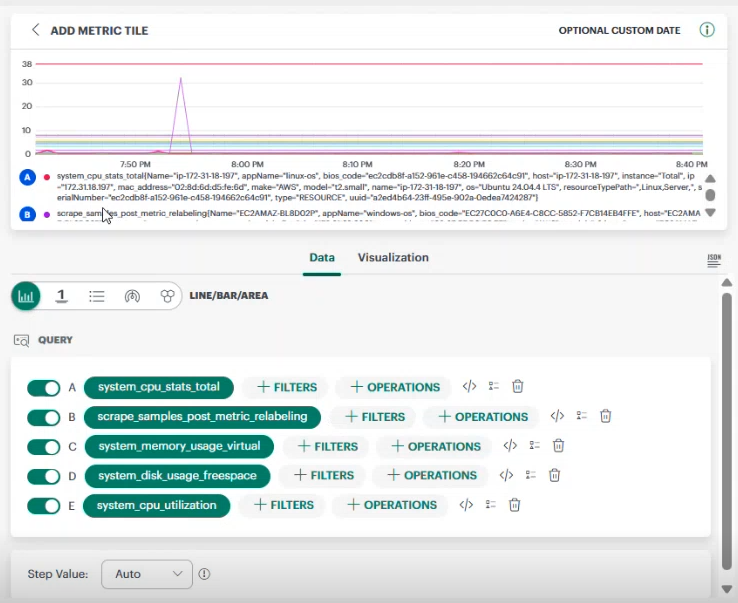
You can now add up to five queries when creating or editing Line and Bar (Combo) visualizations in metric tiles, increasing the previous limit of three queries. This enhancement enables you to compare more metrics within a single visualization, reducing the need for multiple dashboard tiles and making it easier to analyze related data side by side. The query limit for Value visualizations remains three to maintain optimal readability.
See Metric Tile Line/Bar Visualizations for more details.
NativeType Metric Support in Metric Tile
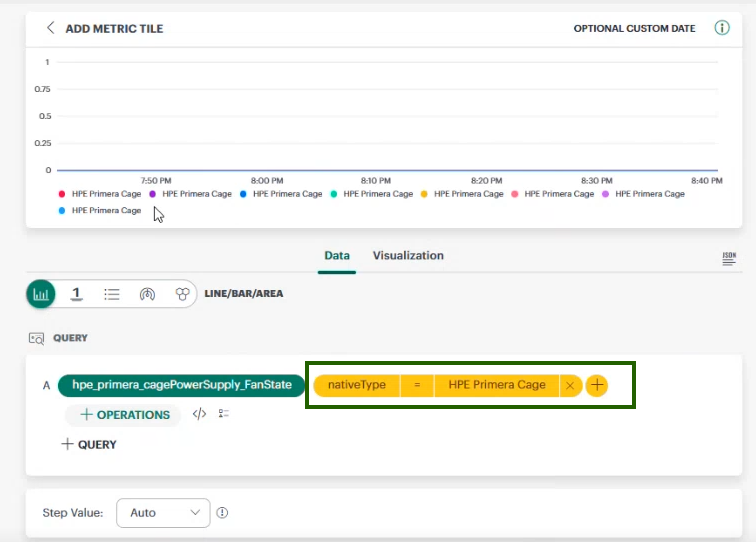
You can now query and filter metrics based on the resource native type. By including the nativeType as a standard label during metric ingestion, you can more effectively aggregate data and create targeted dashboards within the metrics and monitoring layer.
Integrated Netflow Navigation from Dashboard Tiles
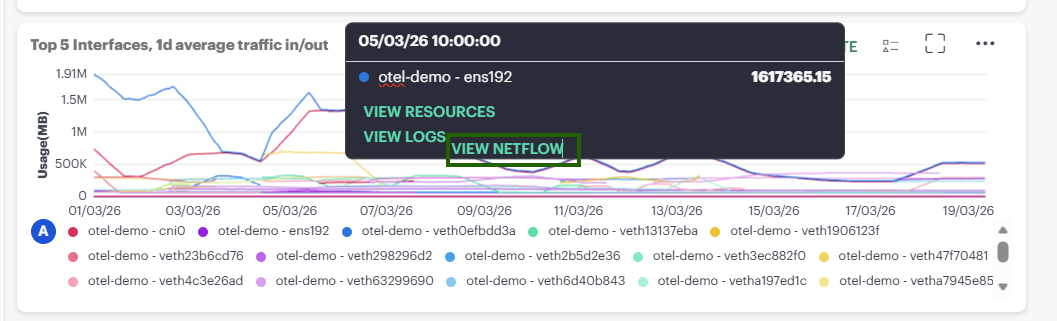
Added a View in NetFlow link to network resource metric tiles, allowing you to navigate directly to NetFlow details for troubleshooting and traffic analysis. The NetFlow view is automatically populated with the relevant device, interface, and timeframe, eliminating the need to manually configure filters.
Core Platform
Enhance Log Configuration Management with Bulk Actions and Export/Import Support
Enhanced Log Management App Configurations is now available with bulk actions for enable/disable/export/import/delete, improved sorting, duplicate name validation, import validation wizard, and audit logging support.
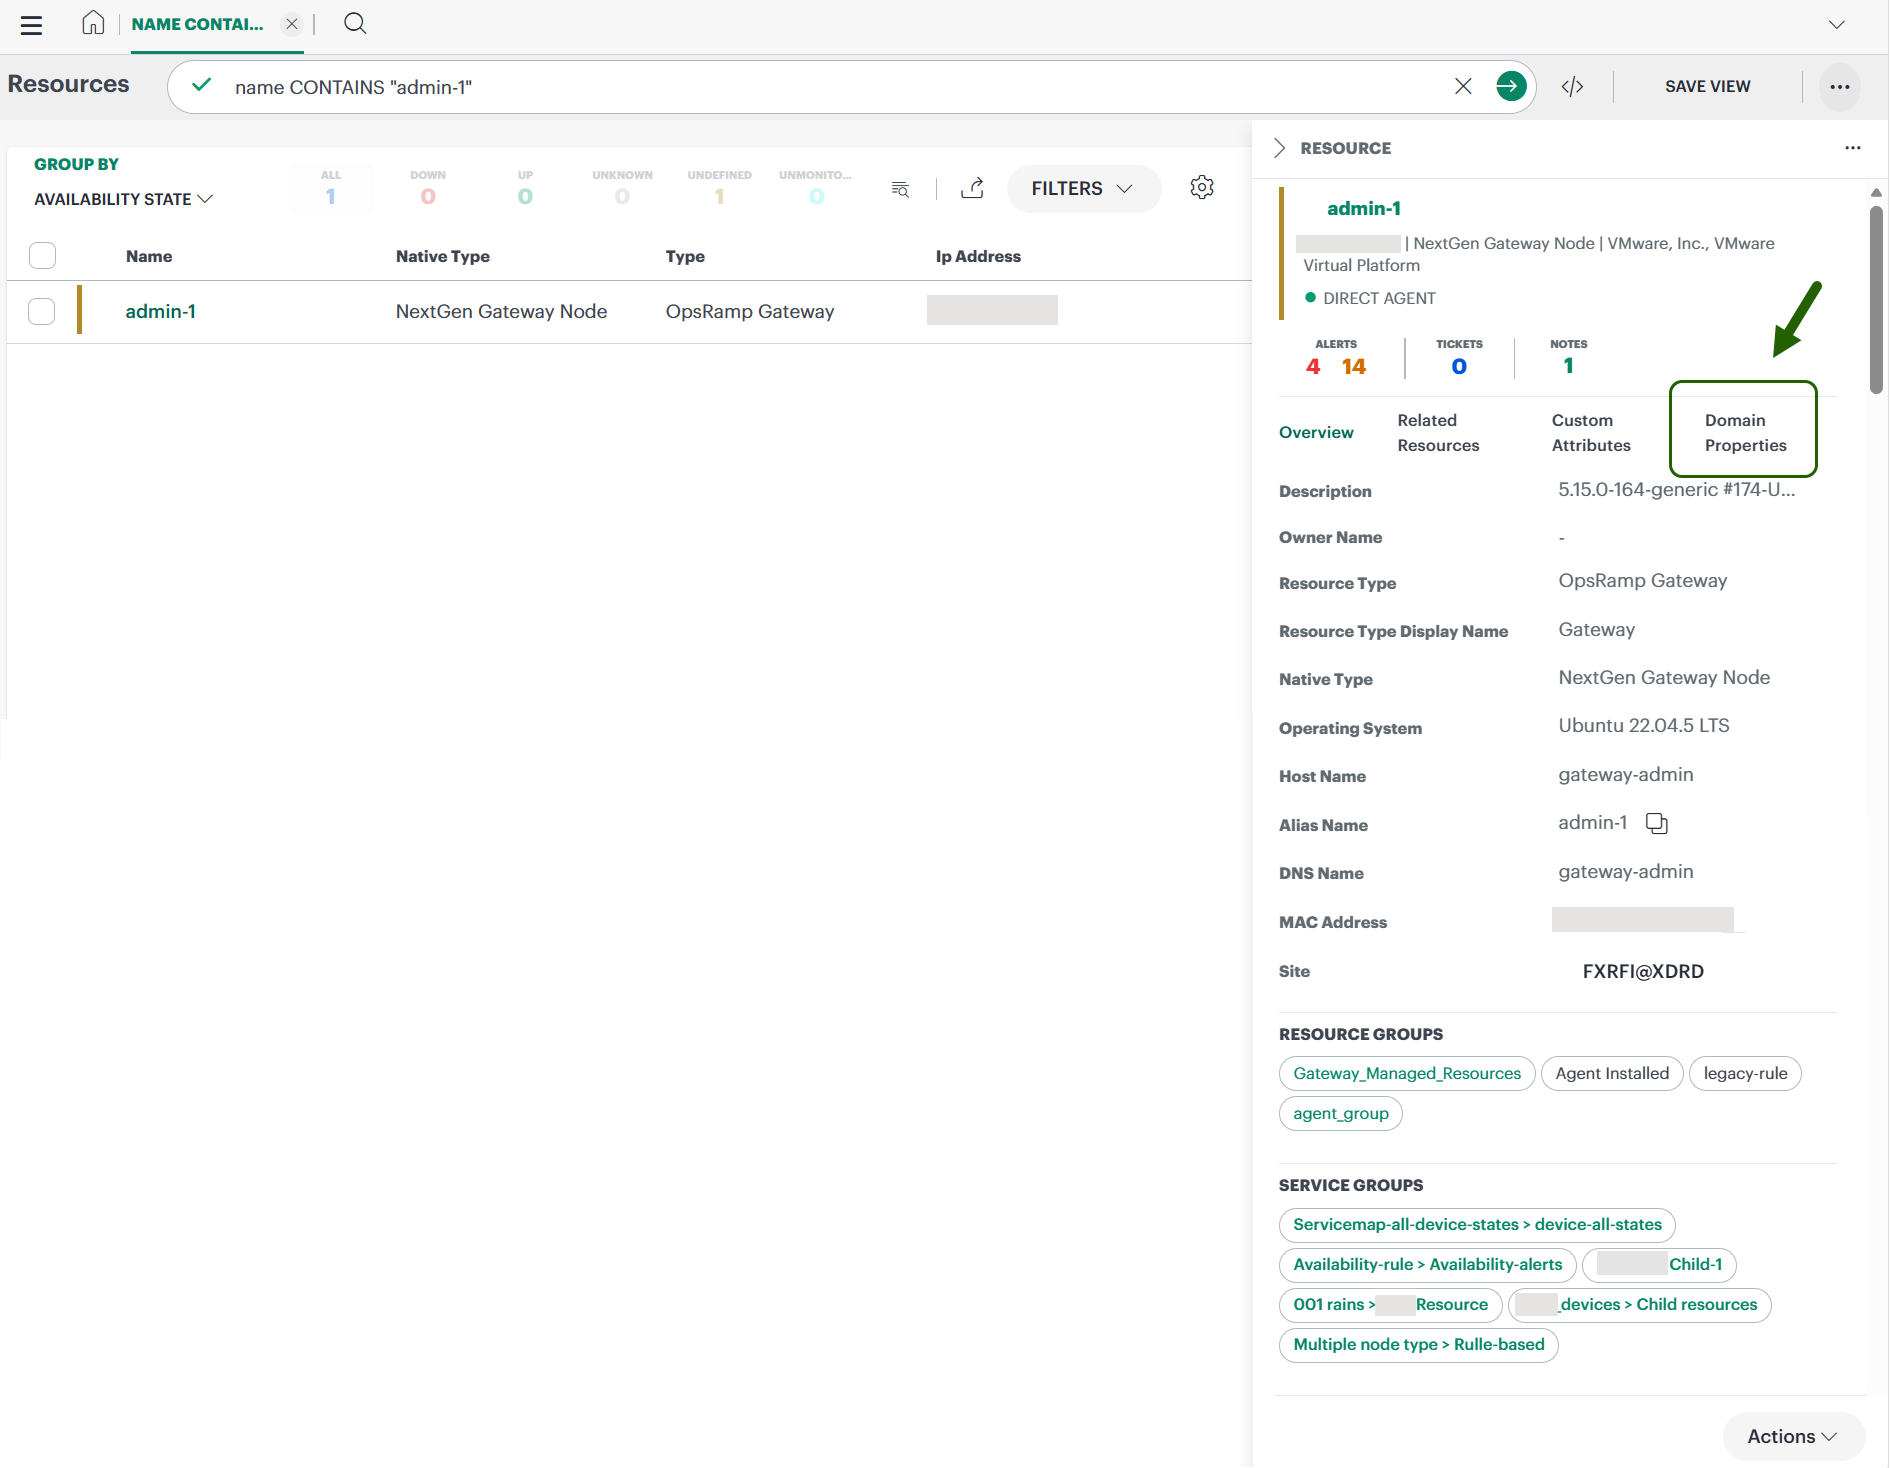
Enhanced Visibility for Domain Attributes
You can now view Domain attributes directly on the Infrastructure Search listing page within the resource summary slide-out.
Quickly review domain properties without navigating to a separate details view, improving efficiency and reducing context switches between pages.
- View domain attributes directly within the Impacted Resource section of the alert detail page.
SNMP Trap Processing is Generally Available
You can synchronize SNMP trap and varbind definitions from the cloud to the OpsRamp Gateway on demand from Collector Profile Details > Actions > Sync SNMP Traps and Varbinds. Automatic synchronization also occurs every few minutes, and delta synchronization transfers only the latest changes to improve synchronization efficiency.
Opening of Collections in action items
Users can now open an entire collection from action items, displaying all views under the collection at once in a single browser tab, eliminating the need to open each view individually.
Resource Management
Resource Type Mapping Improvements
Resources with the following native types are now mapped to their respective resource types instead of being grouped under Others.
All existing resources have been remapped to align with their proper resource types for better organization and discoverability.
Click for mapping information
| Native Resource Type | Resource Type | Native Resource Type | Resource Type |
|---|---|---|---|
| Aruba CX Switch | Switch | HPE Primera Cage | Storage |
| HPE Alletra FC Interface | Network device | HPE Primera Node | Storage |
| HPE OneView Enclosure Interconnect | Network device | HPE StoreOnce Storage Controller | Storage |
| Manager Network Interface | Network device | HPE StoreOnce Storage I/O Module | Storage |
| System Ethernet Interface | Network device | HPE StoreOnce Storage Pool | Storage |
| Network Adapter | Network device | HPE StoreOnce System Fan | Storage |
| Citrix Hypervisor Virtual Interface | Network device | HPE StoreOnce System FileSystem | Storage |
| Cohesity Interfaces | Storage | HPE StoreOnce System HBA | Storage |
| Cohesity Protection Jobs | Storage | HPE StoreOnce System I/O Module | Storage |
| HPE 3PAR Adapter | Storage | HPE StoreOnce System Memory DIMM | Storage |
| HPE 3PAR Battery | Storage | HPE StoreOnce System Temperature Sensor | Storage |
| HPE 3PAR Cage | Storage | Qumulo Quota | Storage |
| HPE 3PAR Node | Storage | Vast Data Fan | Storage |
| HPE Alletra Adapter | Storage | Vast Data NIC | Storage |
| HPE Alletra Cage | Storage | Vast Data NVRAM | Storage |
| HPE Alletra Fan | Storage | Vast Data Switch | Storage |
| HPE Alletra MP B10000 Node | Storage | HPE Alletra MP B10000 Adapter | Storage |
| HPE Alletra Node | Storage | HPE Alletra MP B10000 Cage | Storage |
| HPE Alletra Shelf | Storage | Cohesity Storage Domains | Storage |
| HPE Alletra Temperature Sensor | Storage | HPE XP8 Clpr | Storage |
| HPE MSA Enclosure | Storage | HPE Cray ClusterStor Storage Pool | Storage |
| HPE MSA Pool | Storage | HPE Cray ClusterStor Lustre File System | Storage |
| HPE Primera Battery | Storage |
Identify Relationships Between Templates and Template-Based Alert Definitions
You can now identify the relationship between a Template and the Template-Based Alert Definitions that use it. Navigate to Setup -> Account -> Monitoring -> Templates and select a template. The details panel includes a new Alert Definitions field that shows the number of associated template-based alert definitions. The table displays the alert definition name, scope, and Partner and Client information. If a template is linked to multiple alert definitions, the count appears as a clickable link that opens a popup listing all template-based alert definitions using that template.
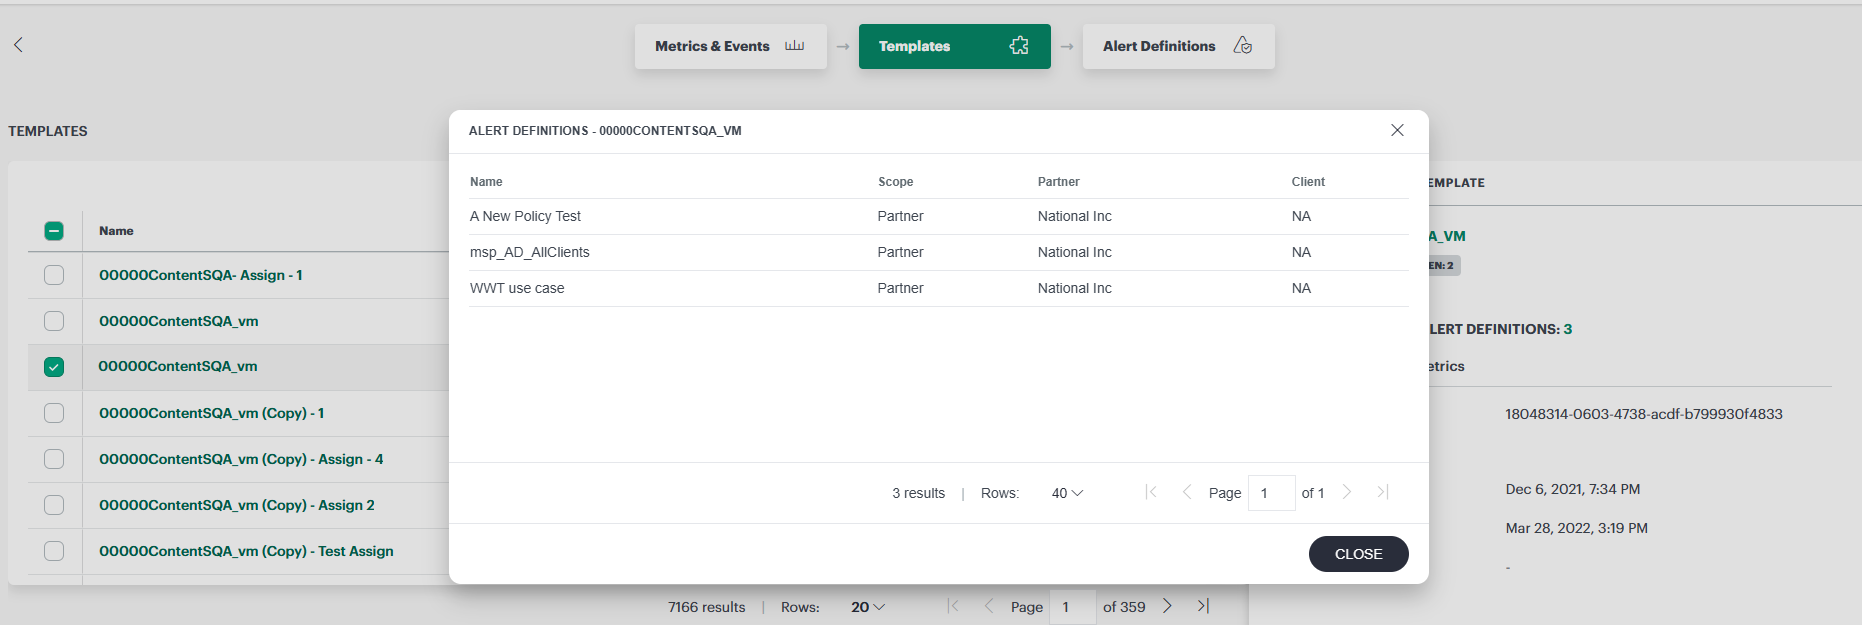
This enhancement helps you quickly identify where a template is used without manually checking individual template-based alert definitions. It is especially useful during template upgrades, such as migrating from v3 to v4, allowing you to locate alert definitions using the older template and update them to the newer version. This simplifies template management, reduces administrative effort, and supports smoother template migrations.
Roles and Permissions Visibility
A user’s full list of assigned roles, including roles inherited from user groups, has been moved under the Actions menu on the Users listing page.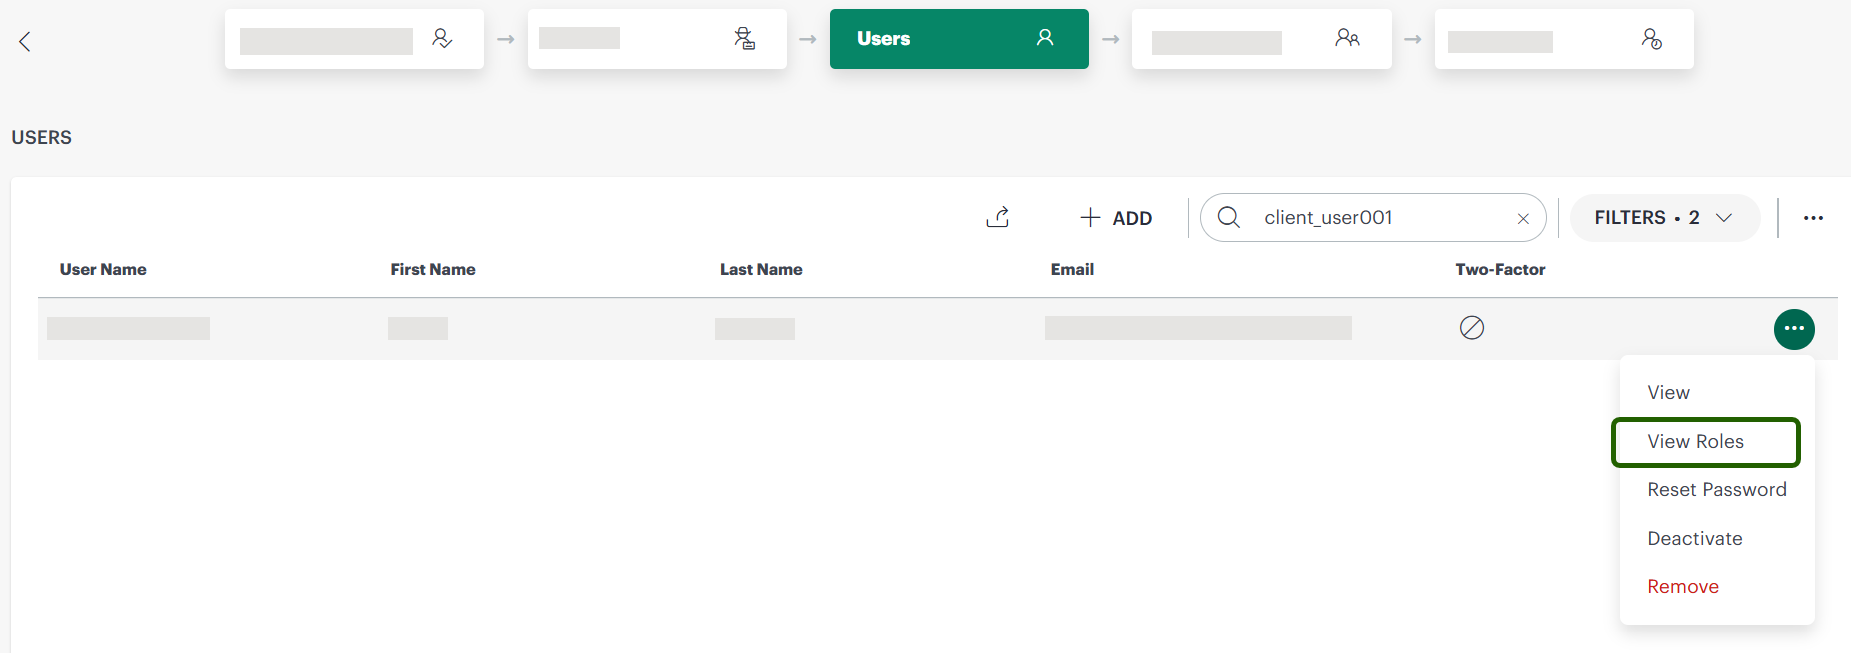
Log Management
Support Multiple AWS Log Archival Configurations
Log Management now supports multiple AWS S3 archival configurations per client. Users can create, enable/disable, and delete independent archival configs - each with its own destination bucket, filtering rules (by host, service, app, log level, or tag), and failure handling - enabling log segregation by environment, region, or compliance scope without manual reconfiguration.
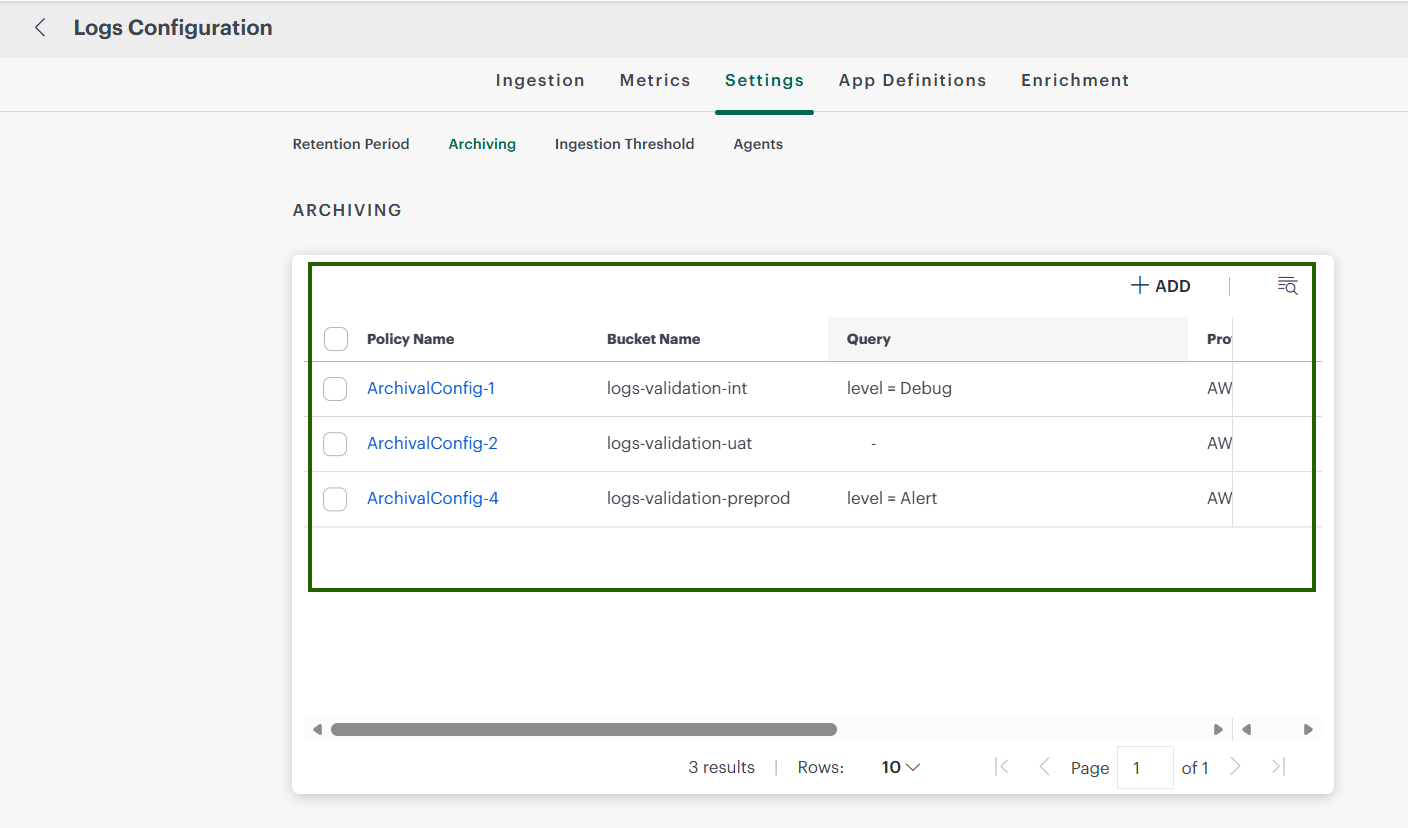
See Archive Logs for more details.
Enhanced LogQL Metrics and Visualizations
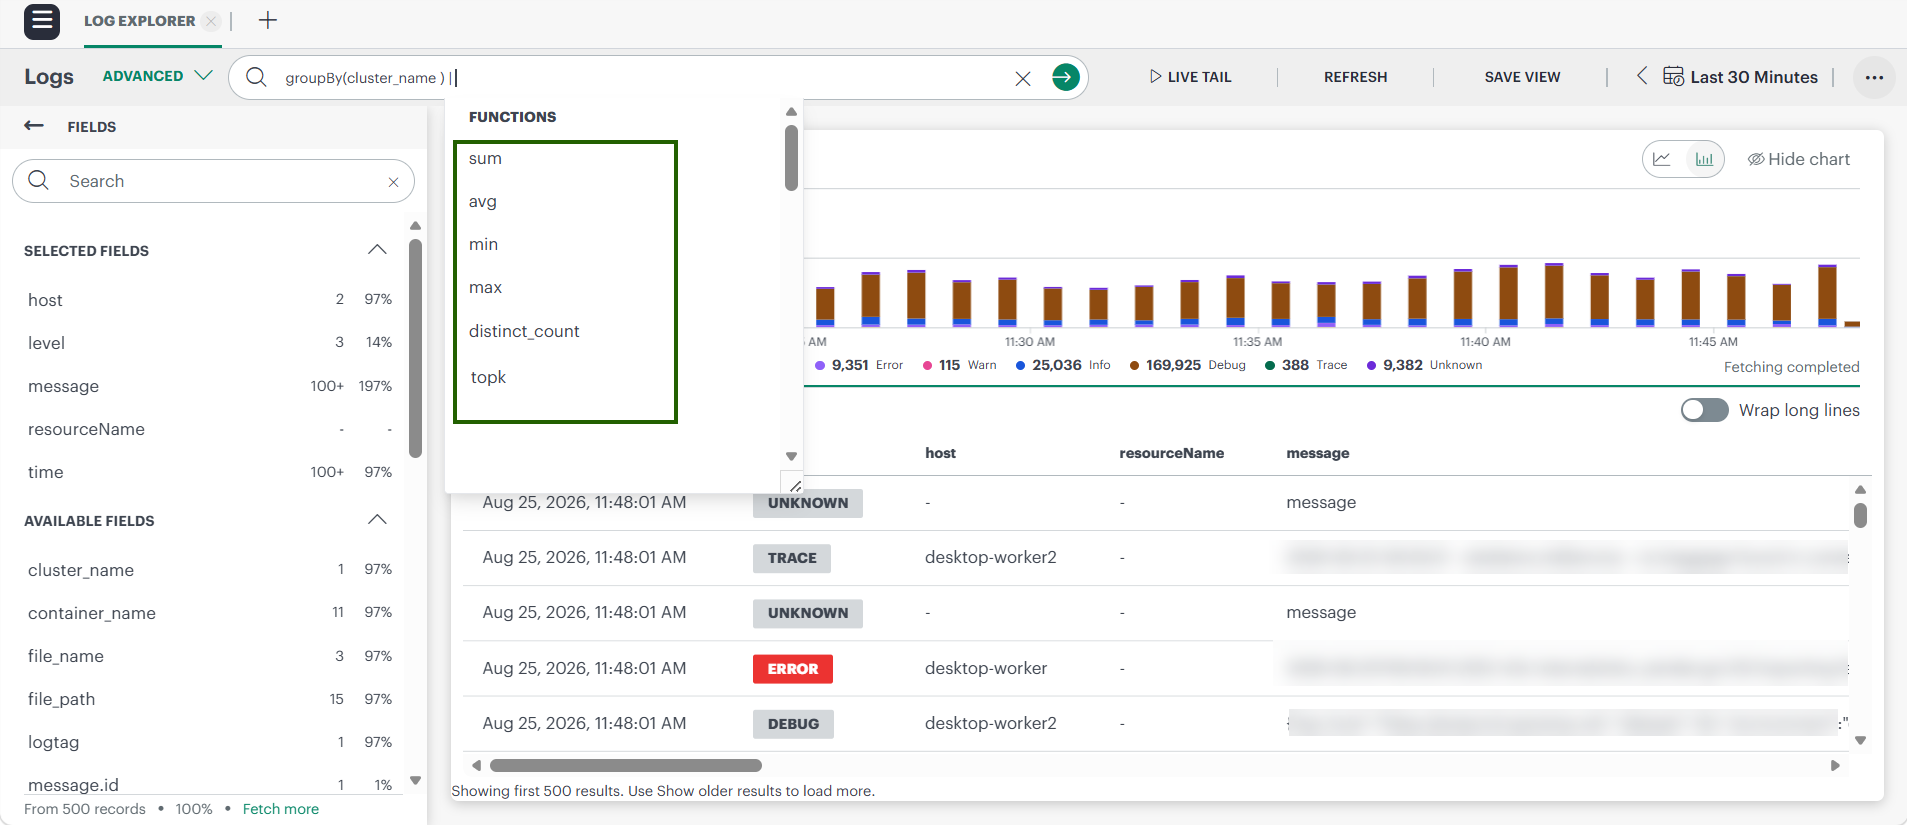
You can now leverage advanced LogQL aggregation functions and multi-dimensional grouping to gain deeper insights from your log data. This enhancement introduces a suite of powerful analytical tools within the Log Explorer, enabling you to perform complex calculations and visualize trends across various dimensions.
Key capabilities:
- Advanced Aggregation Functions: You can now use avg(), sum(), min(), max(), percentile(), percentage(), and distinct_count() in your log queries. These functions allow you to calculate metrics such as average response times, error rates, and unique user counts directly from your logs.
- Multi-Dimensional Grouping: You can group log data by one or more fields (for example, groupBy(host, service)) to break down metrics across your infrastructure and applications.
- Top-N Analysis: The topk(N) modifier allows you to rank and filter results to show only the top N series, helping you focus on the most significant contributors to your metrics.
- Dynamic Visualizations: Charts and tables now dynamically update their Y-axis labels and column headers to reflect the active aggregation function, providing immediate context to your data.
- Improved Log Explorer Experience.
Service Management
Multi-level Sequential Approvals for Change Requests
You can now implement a multi-level, sequential approval workflow for Change Requests within the Service Desk. This enhancement allows you to configure up to three distinct levels of approval, ensuring that requests are reviewed by the appropriate teams in a specific order. For example, a request can be set to require approval from a QA team (Level 1) before proceeding to the CAB team (Level 2).
This feature supports adding multiple groups to any approval level, where approval from any member of the assigned groups advances the request to the next stage. To provide better visibility, tickets remain in a Hold state until all levels are cleared, at which point the status automatically updates to Approved. If a request is rejected at any stage, it is returned to New status, and automated email notifications keep all relevant approvers informed of the pending, approved, or rejected state of the request. This ensures greater governance and control over both normal and emergency change processes.
Patch Management
Automated Patch Retry Mechanism
Introduced an automated retry mechanism for failed patch installations to improve patching success rates and reduce manual intervention. You can now benefit from the system automatically attempting to reinstall patches that fail during the download or installation stages, with up to two immediate retry attempts.
This enhancement ensures that transient issues do not result in immediate failure of alerts. Instead, you will receive a single consolidated alert only after a patch successfully completes, or after all retry attempts are exhausted. Additionally, the system now captures and persists detailed failure reasons, which are available in audit records and patch reports, providing you with better visibility and easier troubleshooting for persistent patching issues.
Process Automation
Expanded Process Definitions Insights Reports
You can now access Problem and Change Request entity types within the Process Definitions Insights reports. This enhancement allows you to gain deeper visibility and analytics into your problem management and change request workflows, enabling more comprehensive tracking of process automation performance across these critical ITIL processes.
Exclude Scheduled Maintenance Time from Resource Availability Reports
OpsRamp now supports the ability to exclude scheduled maintenance windows from resource availability calculations within reports. This enhancement allows you to generate availability scores based solely on the time a resource was expected to be operational, ensuring that planned maintenance does not negatively impact your service level reporting.
When configuring an Availability Details report and selecting Availability By: Resource, you can now enable the Exclude Schedule Maintenance Time option. When selected, the system automatically recalculates the availability percentage by removing the duration of any scheduled maintenance windows from the total reporting period. This feature also supports deleted resources if the Include Deleted Resources option is active, providing a more accurate reflection of operational uptime across your entire infrastructure.
Audit Report Availability at Client Scope
You can now generate and manage audit reports directly at the client scope, eliminating the previous dependency on partner-level access. This enhancement allows client administrators and users to independently track all configuration changes and user activities performed within their specific environment. By enabling this capability at the client level, you gain greater transparency and accountability over your operations, ensuring a clear record of what changes were made and by whom.
Network Configuration Management (NCM)
Bulk Download of Backup Files
Introduced a bulk download capability for network configuration backup files, enabling you to export the latest backups for multiple resources simultaneously. This enhancement eliminates the need for manual, individual downloads, significantly streamlining workflows during large-scale resource migrations, replacements, or rediscoveries.
Network Performance Management (NPM)
Advanced Netflow Query Capabilities
Introduced a new AST-based query builder for netflows to provide a more robust and efficient querying experience. This enhancement replaces the legacy query pipeline with a streamlined process that natively supports both IPv4 and IPv6 addresses, ensuring faster performance and improved accuracy for network traffic analysis.
You can now leverage first-class IP address querying, where IP-type fields support the =, !=, IN, NOT IN operators, all of which accept strictly aligned CIDR ranges. These improvements enable you to perform precise filtering across source, destination, and exporter IP addresses, while the underlying system automatically handles complex routing and multi-tenancy requirements to ensure secure and optimized data retrieval.
Tracing
Trace Explorer UX Improvements
- Contextual slide-out drill-down panels - Investigating a trace no longer opens new browser tabs/view. Clicking a service, operation, or trace opens a stacked slide-out panel from the right, preserving the parent context (such as Filters, time range, service context, trace ID, and search state are retained across all drill-down levels) in the background.
- Layered stack navigation - Drill path (Services List -> Service Details -> Operation Details -> Trace Details -> Related Logs) uses horizontally stacked overlays. Parent panels compress into interactive thin rails showing key identifiers; clicking any rail jumps back to that level.
Trace details page to handle huge number of child spans
Trace details page now handles large traces with 10K+ spans seamlessly using virtualized rendering, a flame chart overview, and optimized expand/collapse - eliminating browser hangs and ensuring smooth investigation of complex distributed traces.
Curated Dashboards for Tracing
- Introduced four out-of-the-box curated dashboards for Trace Management: SL Weekly, SL Success, SL Latency, and Pod Insights.
- SL Weekly -> shows week-over-week trends for traffic volume, response time, and Apdex.
- SL Success -> tracks service availability against a 99.95% success-rate goal with error-budget burn rate.
- SL Latency -> monitors the percentage of requests meeting the 500 ms latency target with slowness-budget tracking.
- Pod Insights -> correlates per-pod latency, throughput, and error rate with CPU, memory, disk, and network utilization.
- Dashboards are automatically visible only when Trace Management is enabled for the tenant.
Reporting Apps
Resource Availability by Resource Time Zone
The Availability Details report now includes an Availability By Resource Time Zone option. When you enable this feature alongside the Availability By Resource setting, the system calculates resource availability based on the specific geographic time zone of each individual server rather than a single fixed time zone for the entire report.
This enhancement ensures that business-hour availability metrics accurately reflect the local operating hours for servers distributed across different global regions. For example, if you generate a report for 8:00 AM to 8:00 PM, the system will automatically apply those hours relative to each server’s actual location (for example, IST, PST, or GMT), providing a more precise and relevant view of your global infrastructure’s performance.
Netflow Insights Export and Filtering Enhancements
You can now export Netflow data directly from the portal to Excel (XLSX) format, enabling more efficient data sharing and offline analysis. This update introduces granular filtering options within the Netflow Insights App, allowing you to generate reports filtered by specific devices, interfaces (including ingress and egress traffic), and custom OpsQL queries. By providing targeted visibility into top talkers such as specific conversations, applications, and endpoints, these enhancements streamline network troubleshooting workflows and help reduce mean time to resolution (MTTR).
Schedule maintenance details in Availability Details App
The Schedule Maintenance Window Name column is now included in the Detailed sheet within the availability details app.
This helps users identify and link each maintenance window to its schedule duration, clarifying which window causes outages and improving the app’s usability.
Benefits:
- Faster Root Cause Analysis: Teams can quickly link availability impact to a specific maintenance window instead of manually tracing schedule durations.
- Trend Analysis: Identifies maintenance activities that repeatedly cause significant availability degradation, helping optimize future procedures.
Public Cloud
Expanded OCI and OCI Alloy Service Support
Implemented discovery and monitoring support for 15 new resource types across both Oracle Cloud Infrastructure (OCI) and OCI Alloy. This enhancement provides you with deeper visibility and comprehensive metric collection for critical infrastructure components, including NAT Gateways, Network Load Balancers, Site-to-Site VPNs, FastConnect, and PostgreSQL DB Systems. Additionally, the update establishes essential parent-child relationships such as Applications to Functions and Container Instances to Containers, ensuring accurate topology representation and improved operational monitoring within your Oracle environments.
Supported Resources:
- Networking: NAT Gateways, Network Load Balancers (including Backend Sets), Site-to-Site VPN (including Tunnels), and FastConnect.
- Compute and Containers: Oracle Container Engine for Kubernetes (OKE) Clusters, Container Instances, and Containers.
- Storage and Databases: File Systems, Mount Targets, PostgreSQL DB Systems, and OCI Cache Clusters.
- Serverless: Applications and Functions.
Alibaba Cloud Discovery and Monitoring Support
OpsRamp has expanded its Alibaba Cloud monitoring capabilities by introducing discovery and monitoring support for several additional resource types. You can now discover and monitor the health and performance of Log Service, DCDN Instances, ESA Instances, RabbitMQ Instances, KMS Keys, Express Connect Instances, Cloud Firewall Instances, Network Load Balancer (NLB), Elastic Cache Instances, and ActionTrail Instances.
This enhancement provides deeper visibility into your Alibaba Cloud infrastructure, enabling you to manage a broader range of services within a single interface.
Support for AWS Bedrock, Azure AI Foundry, and GCP Vertex AI
OpsRamp now supports discovery and monitoring for major AI services across AWS, Azure, and Google Cloud Platform (GCP). You can now gain comprehensive visibility into your AI infrastructure, including AWS Bedrock (models, agents, and guardrails), Azure AI Foundry (model deployments and workspaces), and GCP Vertex AI (endpoints, models, and pipeline jobs). This enhancement enables you to track key performance indicators such as invocation frequency, request latency, and token usage, ensuring better operational control and cost management of your cloud-based AI applications.
See AWS Bedrock, Azure AI, and Google Cloud Vertex AI for more details.
Integration Framework
Automatic Recovery for Stuck SDK Integrations
A Retry button has been added to the Integration global audit logs to help recover stuck SDK integrations. When an SDK integration is unable to complete its Installing or Upgrading state, you can click the Retry button to manually trigger re-processing of the integration data and move it forward.
This resolves stuck integrations without requiring manual recovery process.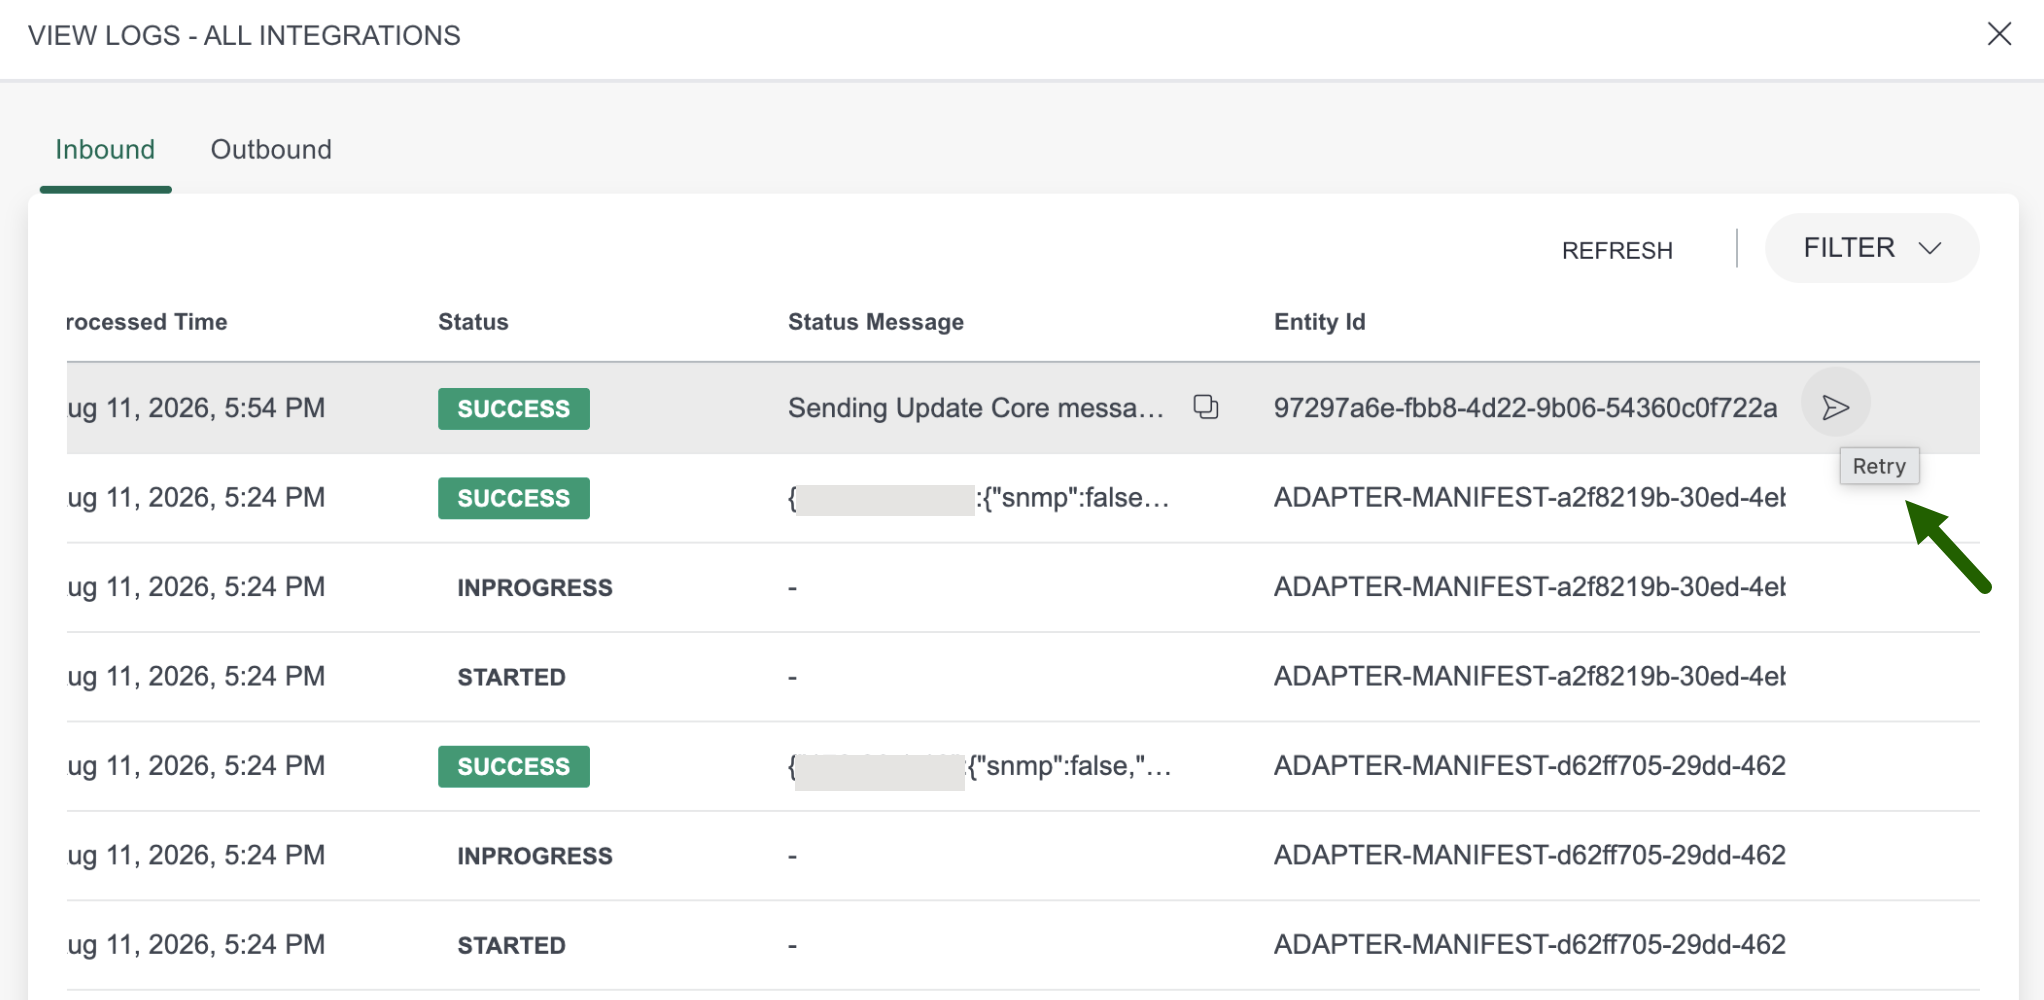
Metrics Engine
Metric Explorer Enhancements
The Metric Viewer has been renamed to Metric Explorer, featuring a redesigned user interface and improved analysis capabilities across metric tiles and the Metric Analysis view.
Maximizing a chart opens a comprehensive Metric Analysis view with clear client and partner details. This view provides deeper insights into your data by including dedicated sections for Trend, Seasonality, and Anomalies. To improve clarity, the interface now includes health status descriptions below graphs and specific empty-state messaging when no seasonality or anomalies are detected. Additionally, you can quickly identify urgent issues through the new latest Critical Anomalies section that helps you identify urgent issues quickly, and streamlined navigation makes it easy to close the analysis panel when you are finished.
SaaS Applications
OpsQL Query-Based Filtering for SaaS Application Discovery
You can now use OpsQL queries to define granular filtering criteria within SaaS application discovery policies. This enhancement extends beyond standard smart filters, allowing you to apply custom attribute-based logic such as filtering by tags, regions, or specific naming conventions to ensure only relevant generic resources and devices are discovered and managed. By providing a more flexible way to include or exclude resources, this update improves discovery precision and ensures your inventory aligns strictly with your operational requirements.
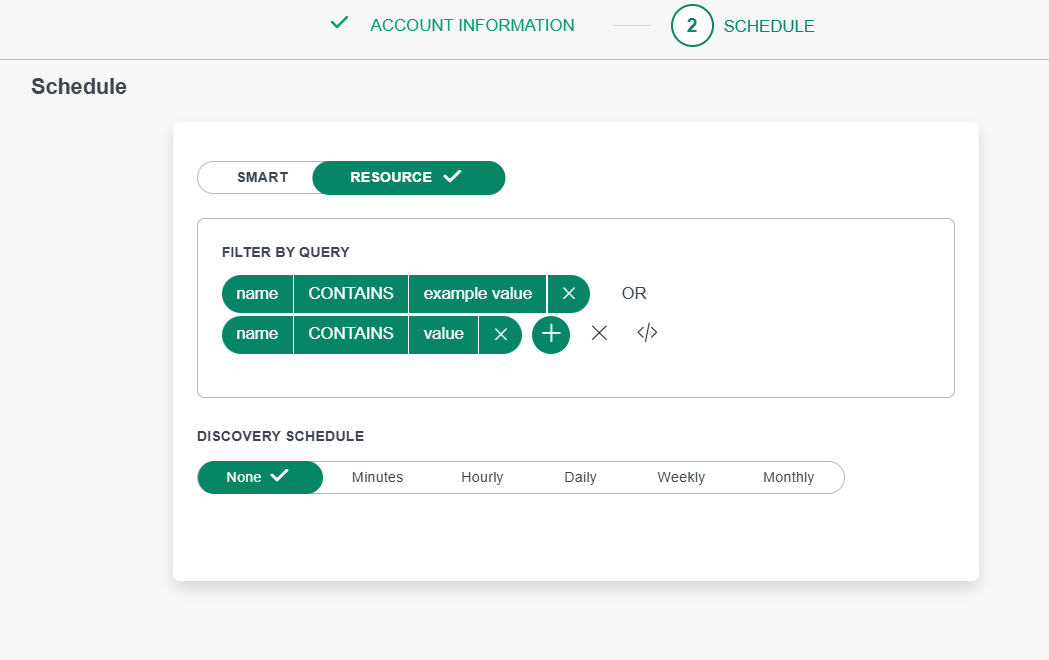
See Configure Resource Discovery Filters for SaaS Integrations for more details.
OpsPilot
KB Management Skills for OpsPilot SRE Persona
OpsPilot now features enhanced Knowledge Base (KB) management capabilities for the SRE persona, enabling you to search, analyze, and manage documentation directly through AI-driven workflows. This update introduces comprehensive tools for creating, updating, and deleting articles and categories, alongside advanced text extraction that allows OpsPilot to retrieve and process information from PDF, DOCX, and XLSX attachments.
These enhancements improve operational efficiency by allowing you to maintain your knowledge of repository through natural language interactions. With integrated quality and relevance scoring, you can ensure that KB content remains accurate and useful. The inclusion of search stemming further improves information retrieval by providing broader, more accurate results for your queries, ensuring you have immediate access to the right documentation during incident resolution or routine maintenance.
Copilot Conversation Renaming
You can now rename your Copilot chat conversations to better organize and identify your discussions. This enhancement introduces a Rename option within the conversation menu, allowing you to replace default titles with custom names up to 200 characters. The conversation list updates instantly upon renaming, ensuring a more intuitive and personalized experience when managing multiple chat sessions.
Process Automation Agent Persona Development
Introduced the Process Automation Agent persona, a specialized AI capability designed to provide comprehensive workflow solutions. This enhancement enables you to leverage an agentic framework that handles complex process automation tasks, including workflow assembly, lifecycle management, and integration of scripting. By utilizing this persona, you can streamline operational efficiency through automated alert management, incident lifecycle handling, and resource allocation, all within a structured and secure environment.
Enhanced LLM Credential Validation
You can now verify the accuracy of your Large Language Model (LLM) credentials before saving them in the configuration form. This enhancement introduces a mandatory validation step for Bring Your Own LLM (BYOLLM) setups, ensuring that only functional credentials are saved to prevent runtime failures.
When configuring providers such as OpenAI, Azure Foundry, Google Vertex AI, or AWS Bedrock, you must click the VALIDATE CREDENTIALS button to trigger a real-time connection test. The SAVE button remains disabled until validation is successful, indicated by a green checkmark. If you modify any credential fields after a successful test, the system automatically resets the validation status, requiring you to re-validate before saving. This improvement provides immediate feedback on credential validity and ensures seamless integration with your preferred LLM providers.
Copilot Support at Partner Level
You can now access and utilize Copilot capabilities directly at the partner level, enabling centralized management and cross-client operations. This enhancement allows partner users to leverage AI-driven insights and automation across their entire managed ecosystem without switching to individual client contexts.
Key capabilities introduced at the partner level include:
- Expanded Scope: You can now use Copilot for SRE, Dashboarding, Documentation, and Onboarding tasks from the partner view. Copilot can intelligently resolve client names or IDs to fetch specific details or perform actions across different tenants.
- Partner-Level Reporting: Copilot usage metrics and reports are now captured and available at the partner level, providing visibility into AI adoption and activity across all managed clients.
- Tailored Skills and Personas: Support for specific skills, personas, and tools has been extended to the partner level. This includes the ability to list and create users for clients, fetch resources per client, and investigate alerts from a partner context.
- Context-Aware Tooling: Tools now support specific scopes (Partner, Client, or both). For example, you can use client creation tools at the partner level, while process automation remains focused at the client level to ensure operational integrity.
General Availability
Derived Metrics is Now Generally Available
Derived Metrics is now generally available (GA) with this release. Derived Metrics allow you to create custom metrics from existing metric streams using PromQL or MetricsQL expressions. The resulting metric is evaluated continuously in the background and stored as a first-class metric within OpsRamp.
Key benefits include:
- Create custom metrics using PromQL or MetricsQL expressions.
- Continuously evaluate and store calculated metric values.
- Use derived metrics in dashboards, Metric Explorer, alert definitions, and reports just like collected metrics.
- Control metric metadata using Source Labels and Static Labels.
- Define up to 50 derived metrics per client.
This capability enables you to extend monitoring coverage by creating reusable metrics based on existing metric data without requiring additional data collection.
See Derived Metrics for more details.
Deprecation
Removal of Classic Process Automation
- As announced earlier in the deprecation notice, Classic Process Automation has been removed from OpsRamp starting with the 2026.08-U1 release. The Automation > Process Automation page, its related UI functionality, and the associated documentation are no longer available. Existing process definitions continue to run in Process Automation 2.0 without interruption. Use Process Automation 2.0 documentation to create, edit, or manage automation workflows going forward.