Dashboards
Default Dashboard Query Enhancement
Introduced a new capability that allows you to dynamically append OpsQL queries to all tiles on a dashboard using a dashboard-level variable. This enhancement enables you to apply a global filter–such as resource state or attribute values–across all visualizations simultaneously at runtime. By selecting a variable value at the dashboard level, the corresponding query criteria are automatically appended to every tile, ensuring consistent data visualization and improving operational efficiency when managing bulk tile updates.

Pin/Star (Favorites) Feature for Quick Access in Dashboards Enhancement
You can now pin or star your most frequently used dashboards for quicker access within the OpsRamp platform. This enhancement allows you to mark specific dashboards as favorites directly from the dashboard list or the individual dashboard view page.
Once pinned, these dashboards are automatically organized into a dedicated “Favorites” or “Pinned Dashboards” section at the top of your navigation, ensuring your most critical data is always within reach. These favorites are user-specific, allowing you to personalize your workspace without affecting other users in the tenant. You can easily manage your list by unpinning dashboards at any time as your priorities change.
For more details, see Configuring the Dashboard Operations
Expanded Multiple Attribute Based Grouping for OpsQL Visualizations Enhancement
You can now use up to five groupBy columns in OpsQL-based dashboard tiles, including alert, resource, and ticket tiles. This enhancement allows for more granular data analysis and sophisticated grouping across various visualization types such as bar, pie, and sankey charts. By expanding the grouping limit from two to five columns, you can gain deeper insights into your data clusters and better visualize complex relationships within your dashboard widgets.
Sankey Visualization for OpsQL Dashboard Tiles Enhancement
Introduced Sankey visualization support for OpsQL-based dashboard tiles to provide real-time visibility into your alert pipeline flow. This enhancement allows you to trace the journey of alert instances as they move through de-duplication, correlation, and inference stages toward their final terminal states. By visualizing these transitions, you can easily identify bottlenecks, detect anomalies in alert volumes, and validate the efficiency of your noise-reduction policies. This transparency helps you ensure that critical issues remain actionable while effectively suppressing noise, ultimately improving the accuracy of your incident management process.
Resource Management
Consistent OpsQL attributes naming convention Enhancement
You can now use consistent naming convention for OpsQL attributes across the Groups, Template-based alert definitions, Service Maps, Sites, and Credentials pages.
This standardization improves usability and reduces confusion when working with attributes across the platform.
Template-based Alert Definitions Improvements Enhancement
This release refines the Alert Definitions listing and details pages to improve user experience and provide more accurate policy information:
- View Policy Logs removed: The View Policy Logs option has been removed from the actions dropdown (…) on alert definition rows for both Global and Non-Global alert definitions.
- Accurate Customization Counts: The Customizations column now correctly excludes main clones from the count, displaying only actual user-created customizations that match the Details page.
- Zero Customization Display: Template-based alert definitions with zero customizations now display
0as plain text without appearing as a clickable link. - Enhanced template-based alert definition details page: Global definitions are now clearly labeled as Default (Defined by OpsRamp) and displayed alongside their Partner and Client customizations as separate cards, each showing their respective definition source.
See Customize alert definition for more details.
State-based Resource Grouping in resource listing pages Enhancement
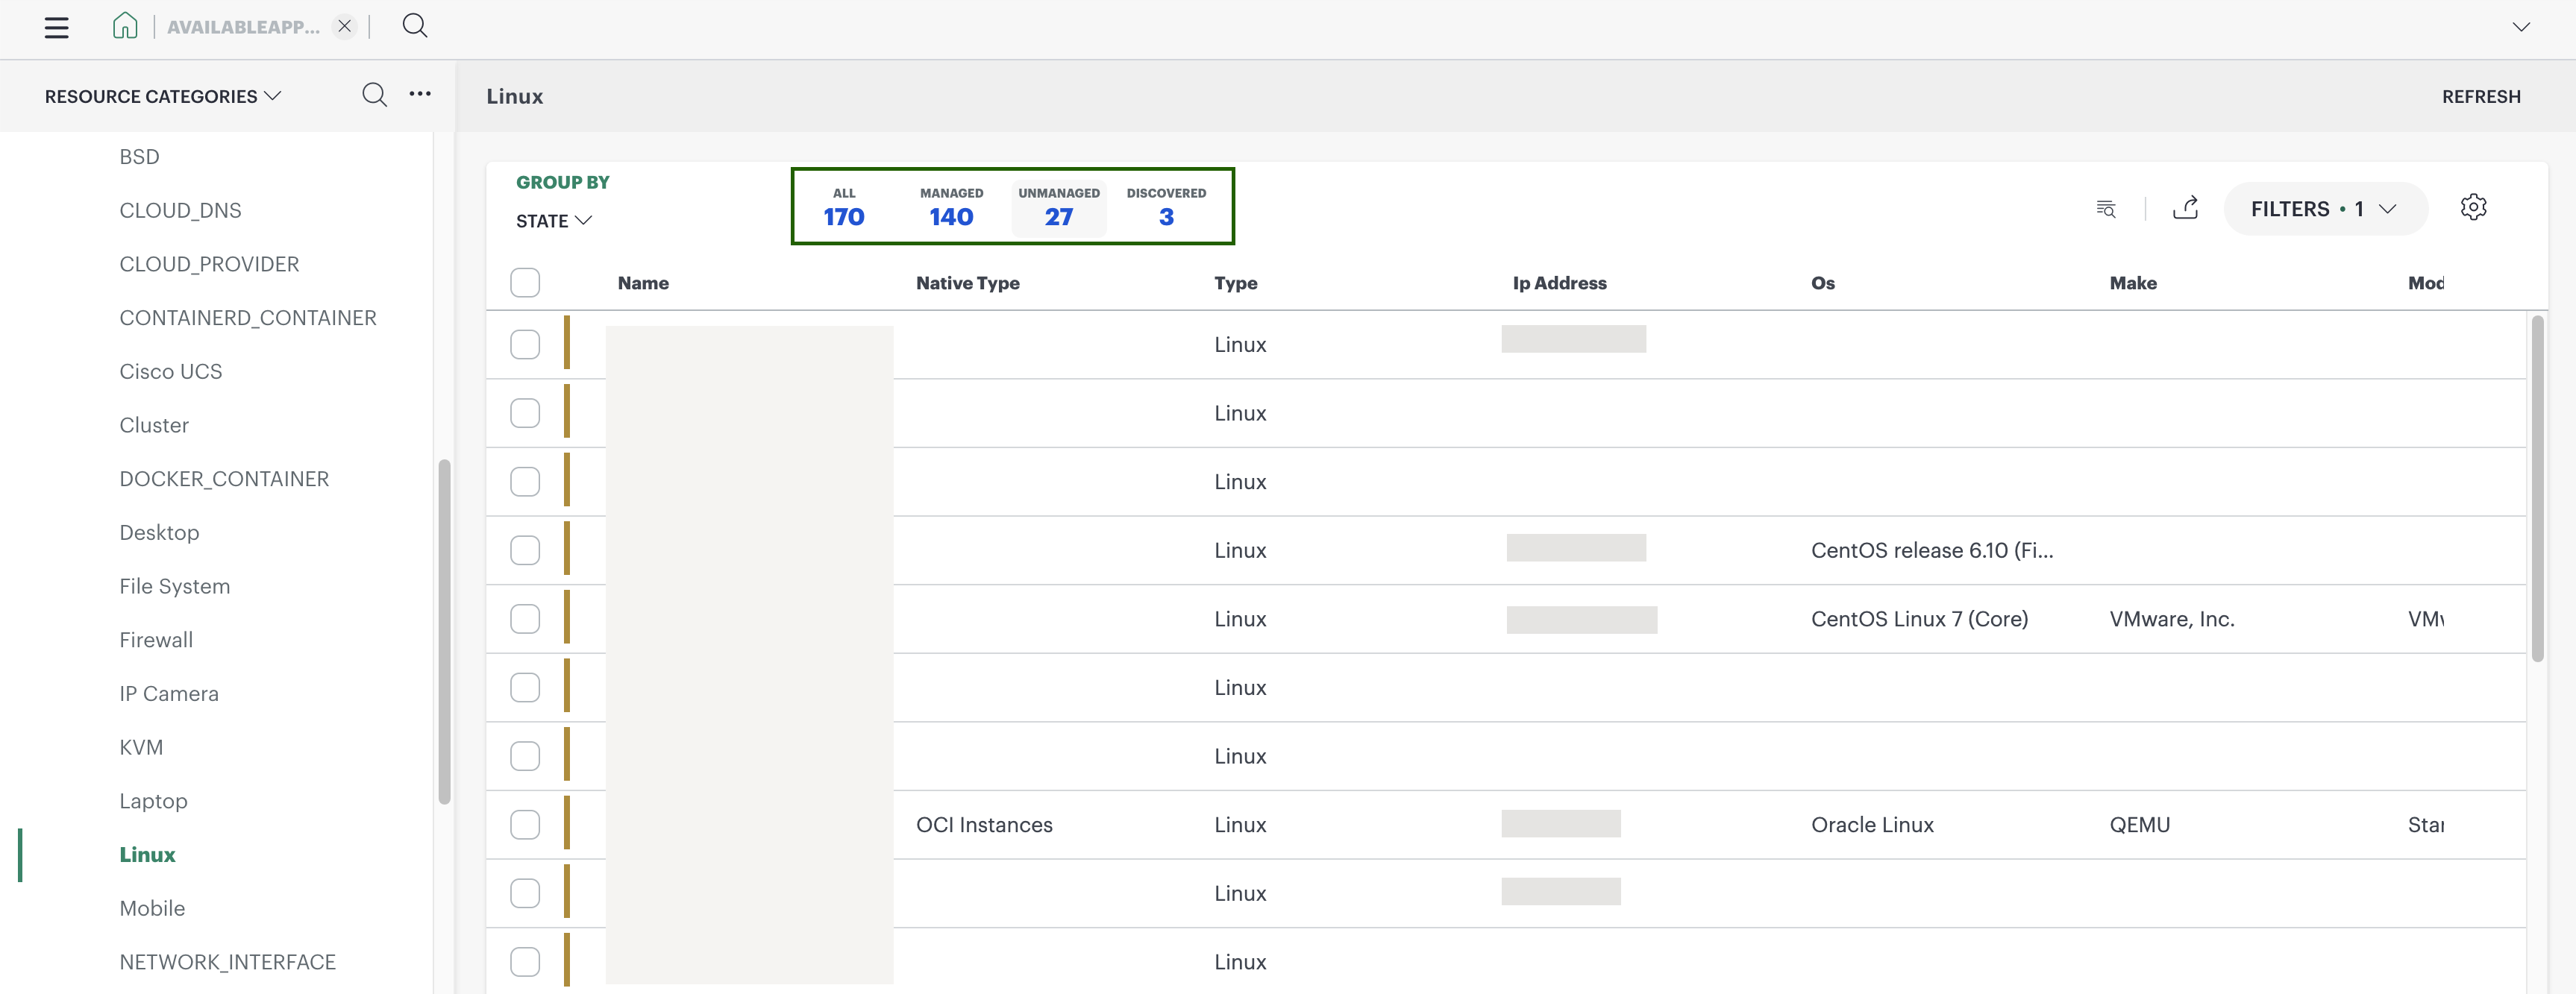
Introduced a new Group By: State option in the resource listing pages, allowing you to organize and view resources based on their operational state. When you select this option, resources are automatically categorized into Managed, Unmanaged, and Discovered groups across Categories, Groups, and Sites views.
This enhancement provides better visibility into your unmanaged and discovered inventory, making it easier to identify and manage resources that require attention.
Remote Command Execution for Namespace-Specific Gateways Enhancement
You can now execute supported remote commands against NextGen Gateway deployments running in specific Kubernetes namespaces.
A new Namespace field is available for supported gateway commands, allowing OpsRamp to dynamically resolve the appropriate gateway pod and execute commands in multi-namespace Kubernetes environments. If no namespace is specified, command execution continues to use the default namespace.
Event Management
Updated Alert Subject and Description for Healed Alerts
You can now ensure that outbound webhook notifications accurately reflect the current state of an alert when it transitions from a critical state to “OK.” By using the newly introduced $alert.latestDescription token, you can configure your webhook payloads to dynamically update the alert subject and description fields.
This enhancement ensures that when an alert is healed or resolved, the notification payload contains the relevant “OK” status message rather than retaining the original critical alert description. This provides you with clearer, more accurate visibility into the real-time status of your resources within integrated third-party systems.
Alert Policy Management Consistency
You can now benefit from improved data consistency and conflict prevention when managing alert policies across different interfaces. To ensure a seamless transition between the classic and modern experiences, the application now automatically detects when an alert policy has been modified using the new UI or API.
Once a policy is updated via these modern interfaces, editing capabilities for that specific record are disabled in the legacy UI to prevent accidental data overwrites. You can still view the policy details in the old UI in a read-only format, where a notification will guide you to continue managing the record in the new UI. This enhancement ensures that your alert configurations remain synchronized and protected from versioning conflicts.
Log Management
Log Explorer Time Window Navigation Enhancement
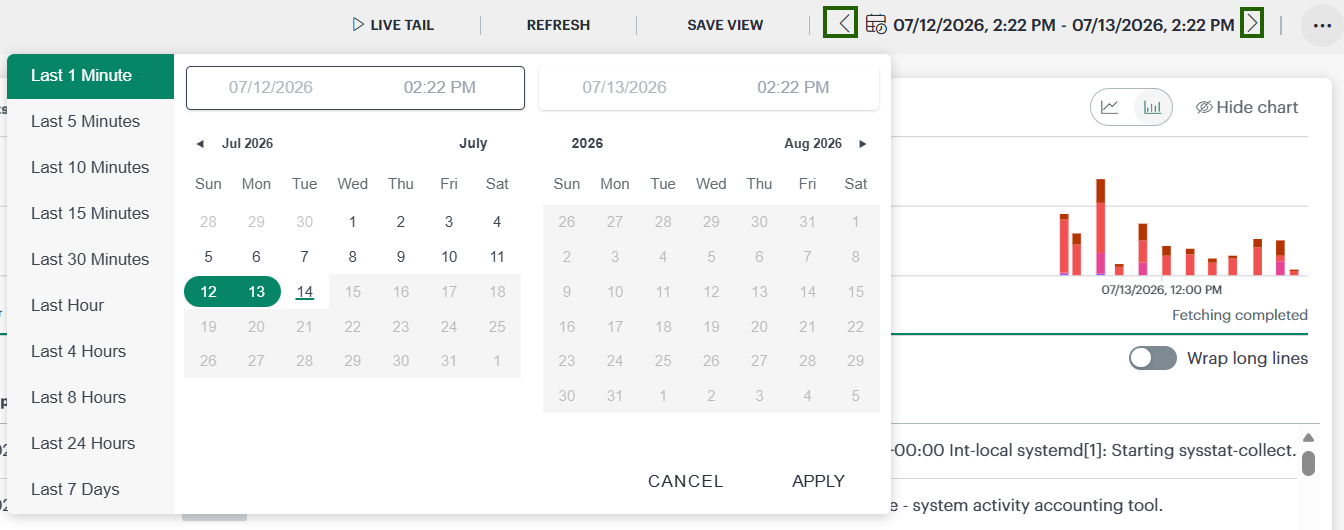
You can now navigate through log and trace data more efficiently using new sequential time controls in the Log and Trace Explorer. These navigation buttons allow you to step backward or forward in time relative to your currently selected window, maintaining the same duration for each step. This enhancement eliminates the need for manual time range adjustments, enabling you to maintain temporal context and accelerate root-cause analysis during incident troubleshooting.
Log Explorer Usability Enhancements Enhancement
Introduced several usability enhancements to the Log Explorer to provide a more efficient and flexible log investigation experience. You can now view up to 500 log messages by default–an increase from the previous limit of 50–with the option to load more entries as needed. Additionally, a new Word Wrap toggle and a horizontal scrollbar have been added to the log message pane, allowing you to easily manage and view lengthy log entries according to your preference.
Enhanced LogQL with Generic Groupby Support Enhancement
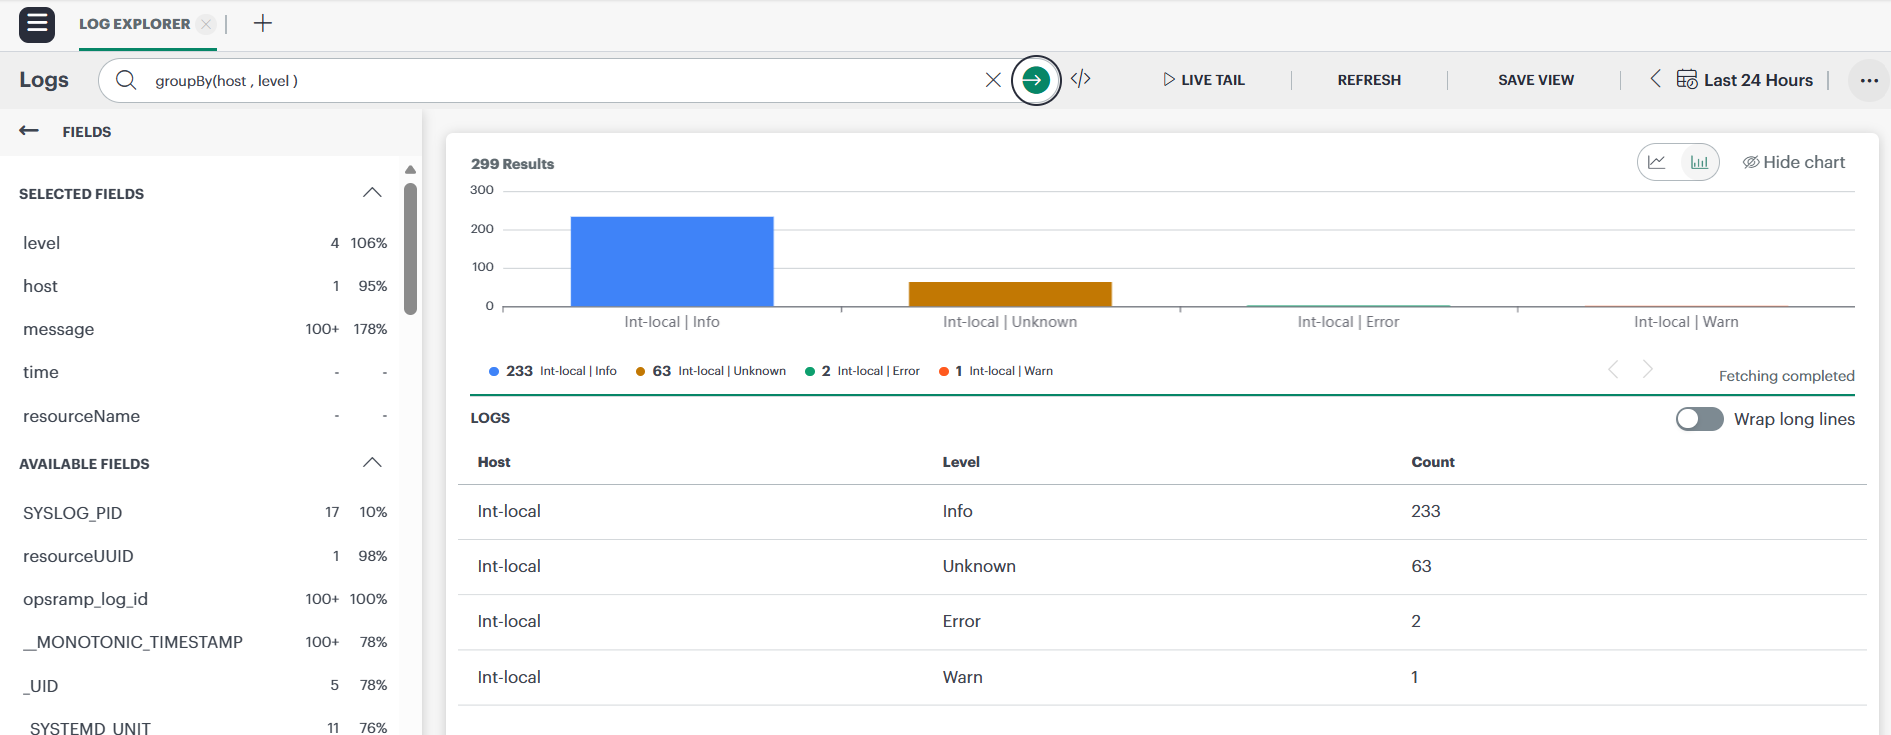
You can now utilize a generic groupby function within LogQL to summarize log data by any available attribute. This enhancement allows you to slice and dice your data dynamically in both the Log Explorer and dashboard log graphs without needing predefined internal metrics.
By applying the groupby function to your queries, you can generate tabular summaries or visualize trends over time using line graphs. For example, you can now count error-level logs and break them down by service name to quickly identify which areas require the most attention. This provides you with greater flexibility and deeper analytical insights into your log data directly from the dashboard and explorer interfaces.
Monitoring Management
Metric-to-Template Traceability Enhancement
You can now identify all monitoring templates associated with a specific metric. From Setup > Account > Monitoring > Templates, use the metric name filter to find all templates that use a metric across Global, Service Provider (SP), Partner, and Client scope.
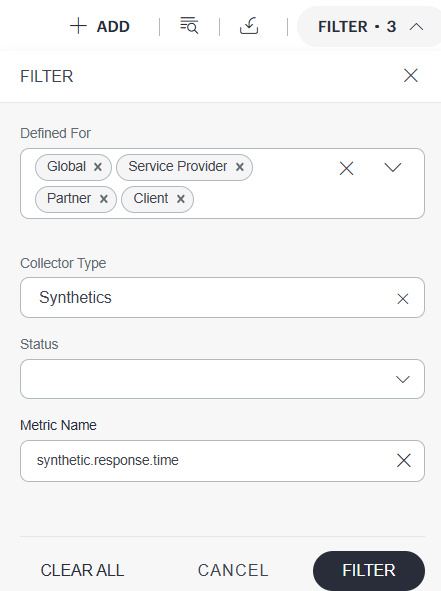
This enhancement helps you quickly determine where a metric is used, simplifying impact analysis before modifying monitoring configurations and providing better visibility into metric dependencies across your environment.
Tracing
Tracing pages UI usability enhancements Enhancement
Enhanced the Tracing user experience by introducing view state persistence, query builder state retention, improved chart interactions, relative time-range preservation, stacked area visualizations, dynamic graph axis rendering, meaningful unsaved view naming, and streamlined service selection workflows.
See Services for more details.
Tracing Custom View Performance Enhancements Enhancement
Improved the performance and usability of Tracing custom views by introducing UI caching, which reduces unnecessary backend requests and delivers faster page load times when navigating between views.
In addition, non-aggregated queries now support larger result sets. When a query does not include aggregation functions such as sum, count, min, max, avg, or rate, the platform automatically applies a higher configurable result limit (default: 1000), enabling you to view and analyze more trace data in a single query.
Enhanced Sharing and Collection Support for Traces Enhancement
Added support for partner-level Collections for Logs and Traces, making it easier to organize and manage observability views. You can now group multiple views into a Collection and share either Collections or individual views with specific roles directly from the partner level within a client context. This enhancement simplifies distributing curated Logs and Traces views across your organization.
See Share Collections for more details.
Public Cloud
Optimized Office 365 Monitoring and Microsoft Copilot Support Enhancement
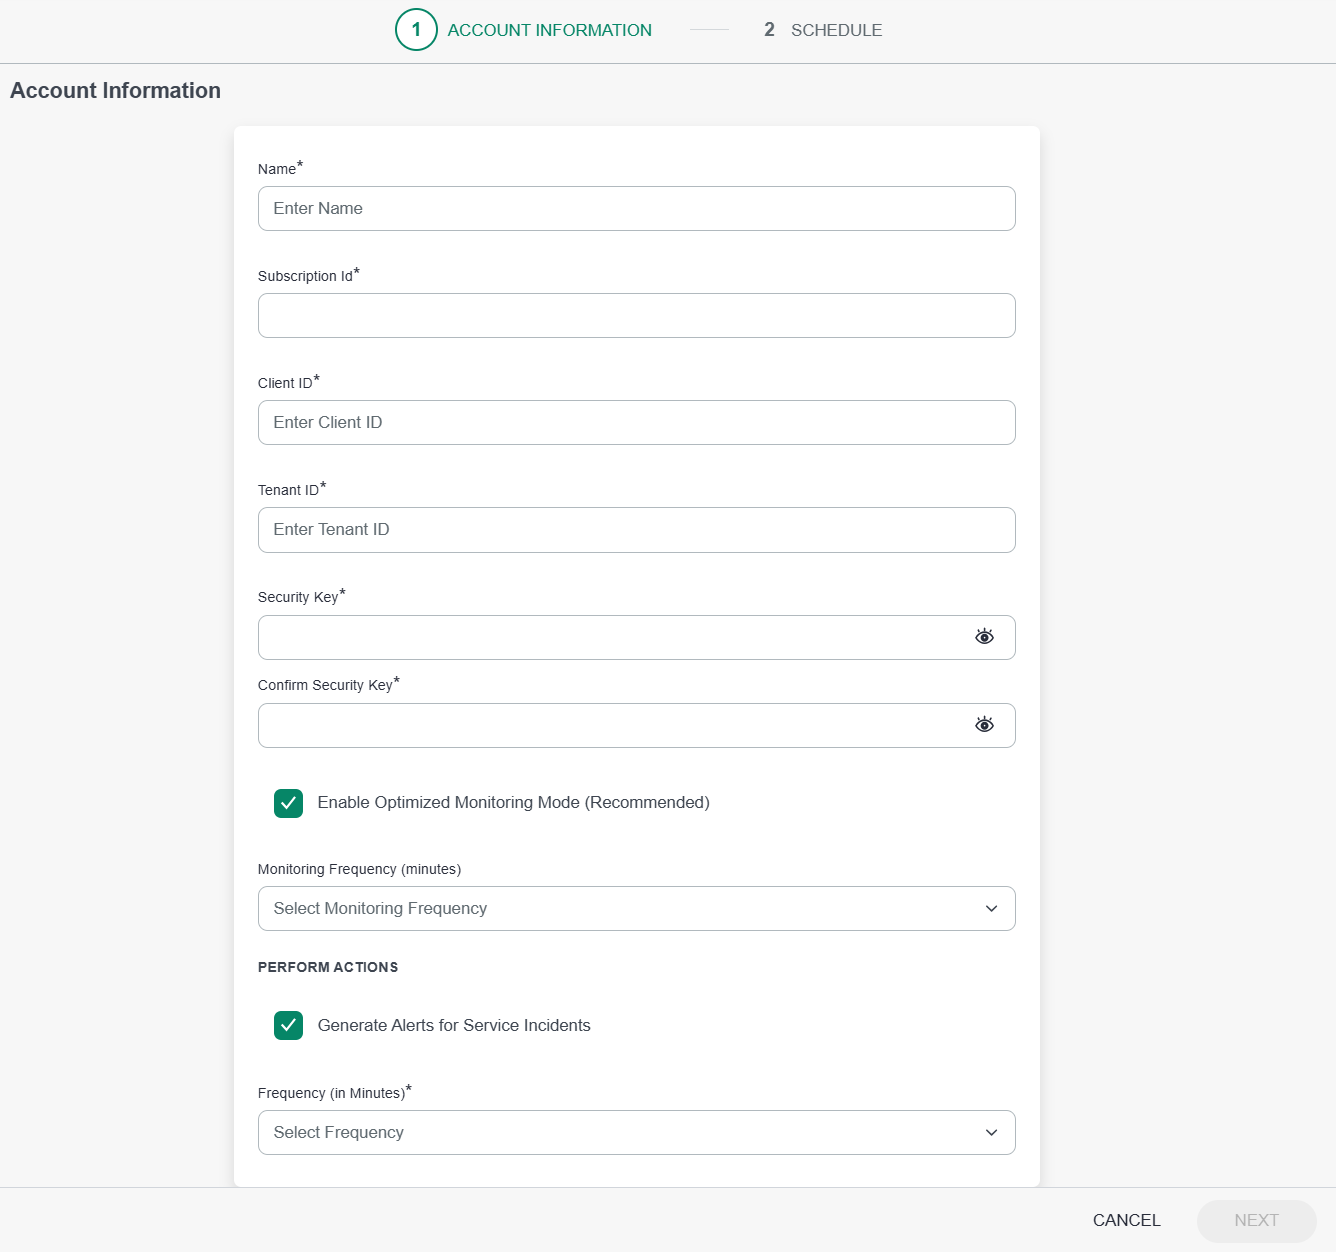
Introduced an “Enable Optimized Monitoring Mode” for Office 365 integrations to improve efficiency and reduce API rate-limiting issues. When enabled, you can collect core health metrics–including Service Status, Incident Count, and Service Outage Hours–for all discovered services through a single provider-level job rather than individual resource-level calls. This update also adds monitoring support for Microsoft Copilot (Microsoft 365), allowing you to track its service health and incident data alongside your other Microsoft 365 services.
See Microsoft 365 for more details.
Saas Applications
Citrix Cloud VDA Integration Enhancement Enhancement
The Citrix Cloud VDA integration has been updated to support Citrix’s unified API endpoint architecture. You can now select your region from a simplified dropdown menu when configuring the service, which automatically maps to the consolidated api.cloud.com hostname or the specific Japan region endpoint. This update ensures your integration remains compliant with Citrix’s latest API standards while simplifying the setup process and maintaining full backward compatibility for your existing configurations.
VMware VeloCloud Token-Based Authentication Enhancement
You can now authenticate VMware VeloCloud (SD-WAN) integrations using API tokens, providing a more secure alternative to username and password credentials. While existing username/password-based integrations remain supported, token-based authentication helps meet security requirements in environments where password-based access is restricted.
To help prevent service disruptions, the platform automatically generates an alert 14 days before a configured token expires, allowing you to renew the token and maintain uninterrupted discovery and monitoring.
Reporting Apps
Multi-Client Selection for Alert Listing and Reporting Enhancement
The Alert Listing App now supports the selection of multiple clients within the Partner scope, allowing you to select up to 50 clients for a single report. This enhancement enables you to efficiently filter and retrieve data for specific groups of clients without the need to manually filter a comprehensive “All Clients” report.
By generating reports tailored to specific client sets, you can more effectively manage data access for account managers and ensure that recipients receive only the information relevant to their assigned accounts.
By selecting only the relevant clients, you can automate report distribution to account managers and stakeholders without exposing data from other clients or performing manual filtering.
Resource Availability Insights Enhancement
Introduced a dedicated Availability Insights section within the Availability Details report to provide you with a comprehensive overview of resource performance and uptime trends. This enhancement allows you to quickly identify high-performing resources and those requiring attention by categorizing them based on their specific availability states.
With this update, you can access detailed breakdowns and “Top 10” rankings, including:
- Availability State Breakdown: A high-level view of resource availability across your environment.
- Top 10 Rankings: Identify the top 10 resources by Resource Type and Native Type, as well as those with the highest Up Time, Down Time, Unknown Time, and Undefined Time.
These insights enable you to streamline resource management and improve operational reliability by focusing on the most critical availability data within a single report.
Enhanced Report Analysis Sharing for Partner Roles Enhancement
You can now share report analysis with partner roles that have limited or specific client permissions. Previously, sharing was restricted to partner roles with access to all clients, which limited collaboration for partner admins managing specific client subsets. This enhancement allows you to select and share analysis with roles whose client access matches the report scope, provided they have the necessary resource permissions. This improvement ensures that the right stakeholders can access relevant data without compromising security or requiring broad administrative access.
Multi-Client Selection Support in Ticket Details Report Enhancement
The Ticket Details reporting application now supports multi-client selection within the Partner scope, allowing you to select up to 50 clients for a single report. This enhancement enables you to filter and retrieve data for specific groups of clients simultaneously, eliminating the need to manually filter a comprehensive “All Clients” report or generate multiple individual reports.
By utilizing this feature, you can efficiently provide tailored reports to account managers or teams responsible for specific client sets, ensuring they only access relevant data. This update streamlines the reporting process and significantly reduces the manual effort required to manage and distribute client-specific ticket information.
Alibaba Cloud Cost Insights Support Enhancement
Implemented support for Alibaba Cloud in the Cloud Cost Usage Trends and Insights reporting application. You can now select Alibaba as a provider in the filter criteria to view comprehensive cost usage data. This enhancement enables you to analyze your Alibaba cloud spend by Cloud Account, Category, Service, Region, and Resource Group, providing deeper visibility and more precise management of your multi-cloud budget.
Network Performance Management (NPM)
Improved Query Performance for High-Volume NetFlow Data Enhancement
Enhanced NetFlow query performance for large-scale environments by introducing time-based query routing method. Depending on the selected time range, queries are automatically routed to the most appropriate data view to improve response times and reduce query latency.
The following time-window routing is used:
- < 8 hours - Raw table
- < 48 hours - 1-hour materialized view
- < 14 days - 1-day materialized view
- < 30 days - 1-week materialized view
Note: Some detailed flow attributes are not available in the aggregated materialized views. If a query includes attributes that are unavailable for the selected time range, the system prompts you to reduce the time window to retrieve the requested information.
OpsPilot
Partner-Level LLM Credential Support Enhancement
Introduced support for partner-level LLM credentials in OpsPilot. Partner users can now create and manage LLM credentials at the partner level and seamlessly use OpsPilot features across associated client environments.
When a partner user accesses a client context, the platform automatically identifies and applies the LLM credentials configured for the partner organization, eliminating the need to configure credentials separately for each client. Similarly, client users must configure LLM credentials at the client level to access OpsPilot capabilities within their own environment.
New Patch Management Capability Enhancement
Introduced the Patch Manager Agent (patch-manager) in OpsPilot to streamline patch management activities through a conversational experience. The agent enables users to quickly assess patch status, identify risks, manage compliance requirements, and perform patch-related operations, helping reduce manual effort and improve operational efficiency.
End-of-Life Announcement
End of Life: Classic Alert Browser Deprecated
Effective July 2026, Classic Alert Browser will reach End of Life (EOL) and will no longer be supported in OpsRamp. This change is part of our ongoing effort to deliver a more modern, consistent, and scalable experience. See Deprecation Notice for more details.
- Access to Classic Alert Browser will be removed starting with the July 2026 release.
- Your existing data configured in the Classic Alert Browser will continue to be available and visible in the V2 Alert Browser.