Dashboards
Supporting Multiple Variable Value Selection for Dashboard Variables Enhancement
You can now select multiple values for dashboard variables, enabling more dynamic and flexible data filtering across your dashboards. This enhancement allows you to filter visualizations by a set of parameters such as multiple severity levels or service types simultaneously, rather than being restricted to a single selection. The ensures seamless data retrieval and a more comprehensive view of your environment’s performance.
For more information, see Create Dashboard Variables.
Core Platform
Accessibility Support for Advanced Query Builders Enhancement
You can now use keyboard navigation within the advanced OpsQL and PromQL query builders.
This enhancement allows you to navigate through dropdown menu items using the up and down arrow keys and select your desired option with the Tab key. These improvements provide a more accessible and efficient experience when building complex queries, ensuring you can manage your monitoring data without relying solely on a mouse.
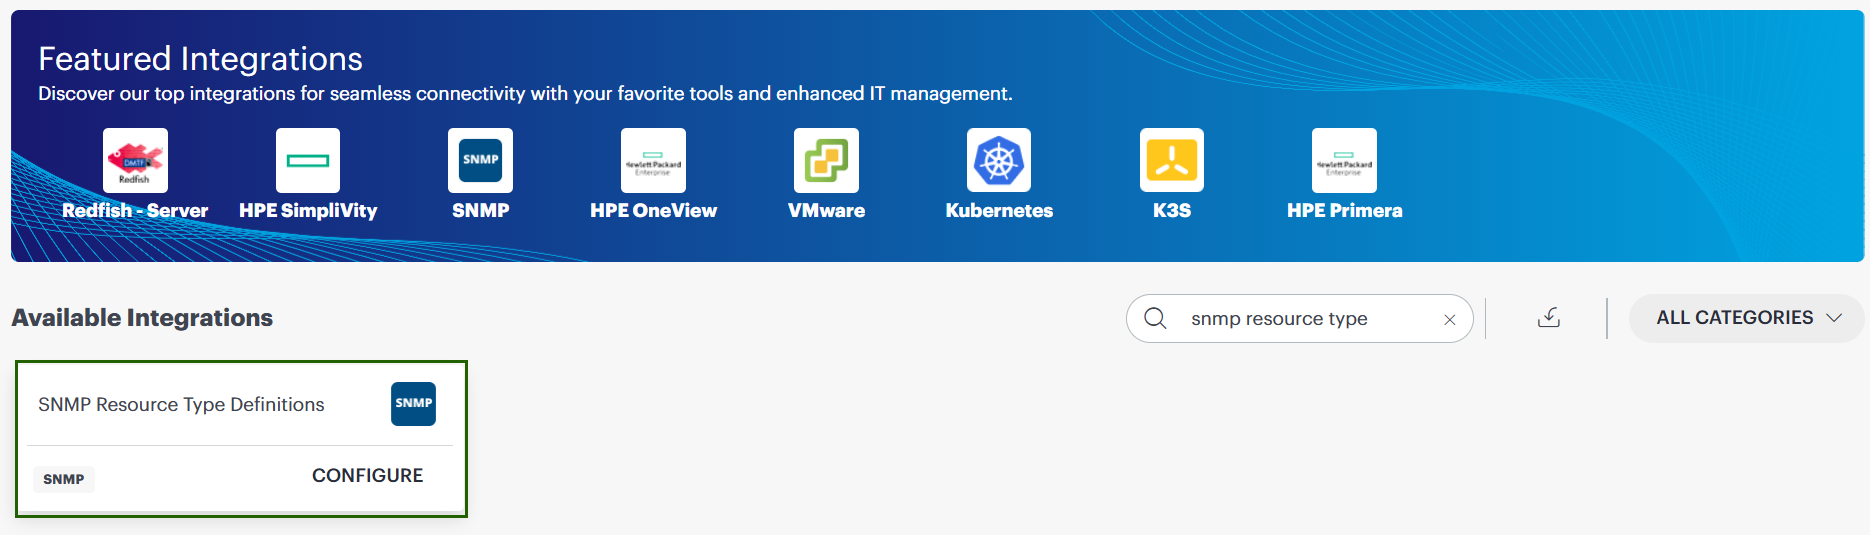
SNMP Discovery Definition Management New Feature
You can now independently create and manage custom SNMP device discovery definitions within your specific organizational scope, such as Client, Partner, or Service Provider.
This reduces turnaround time for adding support for new device types significantly reducing the time required to discover and classify new network device models.
See SNMP resource type definitions for more information.
Resource Management
Parent-Child Resource Visibility in Infra Search Enhancement
You can now view the immediate parent of a resource (if the resource has a parent resource).
Parent properties are now added to child resources. Because of this, you can:
- View parent details in child-level domain properties.
- Search by parent properties in Infrastructure Search to return all related child resources.
- Identify parent-child relationships faster for troubleshooting.
See Parent-Child resource visibility for more information.
Restricted Credential Assignments for Cloud Accounts Enhancement
OpsRamp introduced restrictions to prevent policy-based credential assignments to or from cloud accounts, ensuring increased stability and security. Cloud account-level credentials are no longer visible or selectable within policy configuration screens, and API modification attempts are automatically rejected.
This enhancement helps you:
- Maintain reliable connectivity across your cloud infrastructure.
- Avoid configuration errors from unintentional credential removal or assignment.
- Strengthen security by preventing invalid credential operations.
See Resource Group Details for more information.
Integrations Framework
ServiceNow Australia Release Compatibility Enhancement
OpsRamp has introduced official support and certification for the ServiceNow Australia release. You can now seamlessly integrate and maintain compatibility with the latest ServiceNow version, ensuring uninterrupted service management workflows and synchronization between the two platforms.
This update provides you with the confidence to upgrade your ServiceNow environment while maintaining a certified and validated integration.
Migration of Gateway-Based Integrations Between Collector Profiles New Feature
OpsRamp now supports migration of Gateway-based integrations between collector profiles using the Change Collector Profile capability. Existing discovery and monitoring configurations are preserved during migration, enabling seamless transfer of integrations between Gateways for improved resource utilization and operational flexibility.
Tenancy and RBAC
Enhanced Role-Based Access Control for Client and Device Notes Enhancement
You can now create, update, and manage notes using Client_Edit and Device_Edit permissions without requiring broader administrative access. These permissions are consistently enforced across both the Classic and New UI.
See View and edit client details and Resource actions for more information.
Event Management
Bulk Incident Creation and Streamlined Assignment Enhancement
You can now:
- Select multiple alerts from the alert listing page to create a single incident.
- Auto-populate incident descriptions with details from all selected alerts.
- Use the Assign to me button below the Assignee field for one-click self-assignment.
This reduces manual effort and speeds up ticket creation.
Enhanced Maintenance Alert Handling Enhancement
You can now suppress a broader range of alert types during scheduled maintenance windows to reduce noise and prevent false positives. In addition to standard monitoring alerts, you can now configure maintenance windows to automatically handle TRACE, LOG, AGENT, and MAINTENANCE alert types as scheduled maintenance.
This enhancement helps ensure:
- Non-monitoring alerts generated during planned downtime are correctly categorized.
- Suppression from primary alert views and notifications.
- Cleaner alert consoles and better focus on genuine issues.
- Continued data availability for audit and analysis.
For more information, see Create a scheduled maintenance.
Enhanced Incident Visibility with Correlated Alert Details Enhancement
You can now include correlated alert details in incidents sent to ServiceNow.
Use the $utils.inferenceAlertIds($incident.alertIdList) token to retrieve and display inference alert IDs attached to an incident.
This improves troubleshooting with a consolidated view of correlated alerts (limited to the top 5 for clarity) directly in ServiceNow incident comments.
Log Management
Enhanced Log Service Metrics Visibility Enhancement
Introduced a new framework that enables the publishing of specific log and trace service metrics directly to your tenant. This enhancement allows you to monitor critical operational data, such as log ingestion rates and archival health, in real-time through your own dashboards and alerts.
By differentiating internal operational metrics from customer-facing data, you now have better visibility into:
- Log processing health
- Ingestion volumes
- Archival status
This helps you proactively manage ingestion rates and associated costs.
For more information, see Enhanced Log Service Metrics Visibility.
Service Management
Task Attachment for Change Requests Enhancement
You can now attach new or existing tasks directly to Change tickets in the Service Desk.
This helps you:
- Link related activities and action items to a specific Change request.
- Improve tracking and coordination of associated tasks.
Patch Management
Yearly Recurrence Support for Patch Management Maintenance Windows Enhancement
Patch Management now supports yearly recurrence patterns in scheduled maintenance windows.
When a yearly schedule is configured in Patch Configurations, the corresponding maintenance window is created and executed with the same recurrence pattern.
Transition to Scripts V2 Enhancement
Support for legacy Scripts (v1) has been fully removed starting with the OpsRamp 2026.06-U1 release. All users must now use Scripts (v2) for creating and managing scripts.
To ensure a smooth transition, the Back to Previous Experience option will remain available on the Scripts (v2) landing page until the 2026.07-U1 release. After that, access to the legacy Scripts (v1) interface will be completely discontinued.
What this means for you:
- Scripts (v1) is no longer supported or accessible.
- Scripts (v2) is now the standard for all scripting activities.
- Users must migrate and manage all scripts using the Scripts (v2) experience.
Process Automation
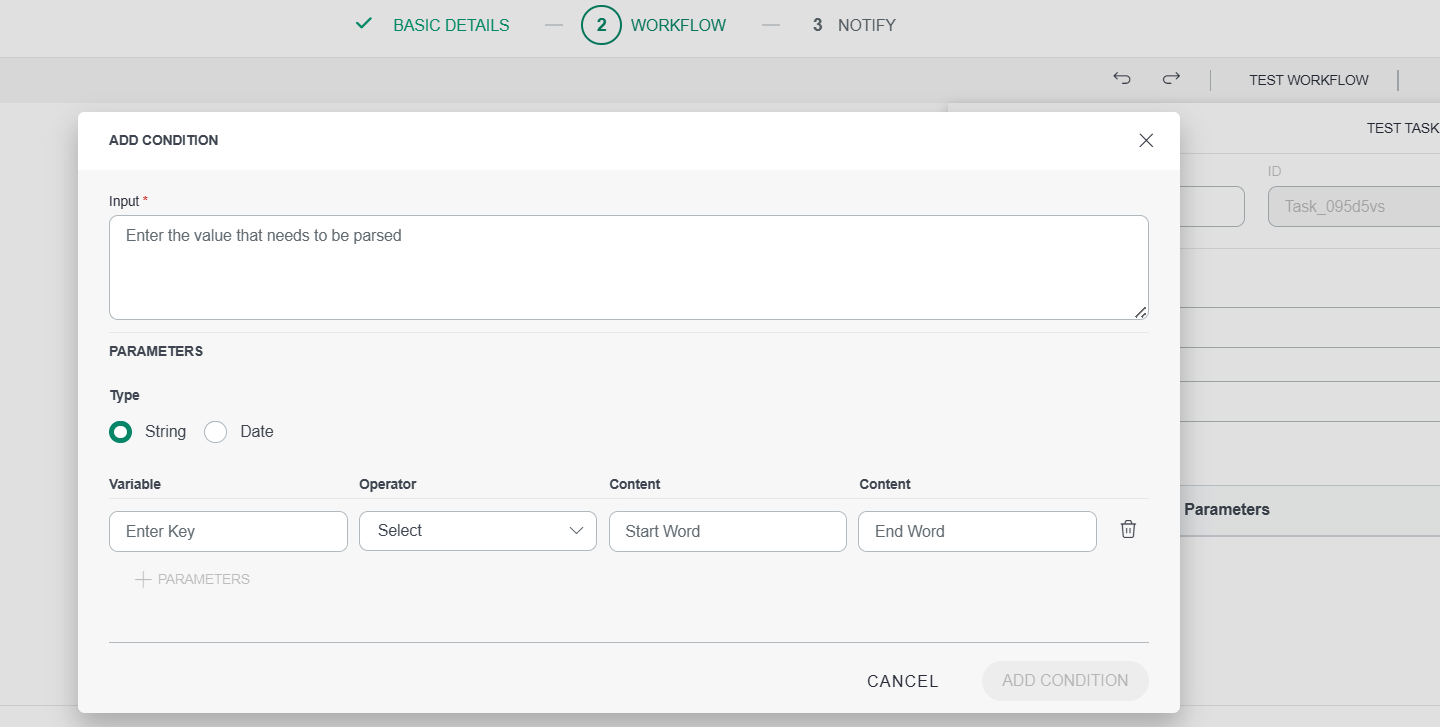
Enhanced Data Transformation Capabilities Enhancement
Process Automation 2.0 introduces additional data transformation operations in the Utility Service Task.
These enhancements expand support for string and date manipulation alongside existing parsing capabilities, enabling more flexible handling of complex data structures and variables in workflows.
See Parser Task for more information.
Platform Service Task Enhancement
Added a new service, Update Alert Tags, that enables workflows to create new alert tags or update existing ones.
This allows dynamic assignment and modification of tag values during execution to improve:
- Alert classification
- Filtering and visibility
- Downstream automation
Problem and Change Request Workflow Support Enhancement
Process Automation now supports Problem and Change Request workflows with domain-backed Get, Find, and Update operations, signal-based start events, and enhanced token and typeahead capabilities.
See Platform Service for more information.
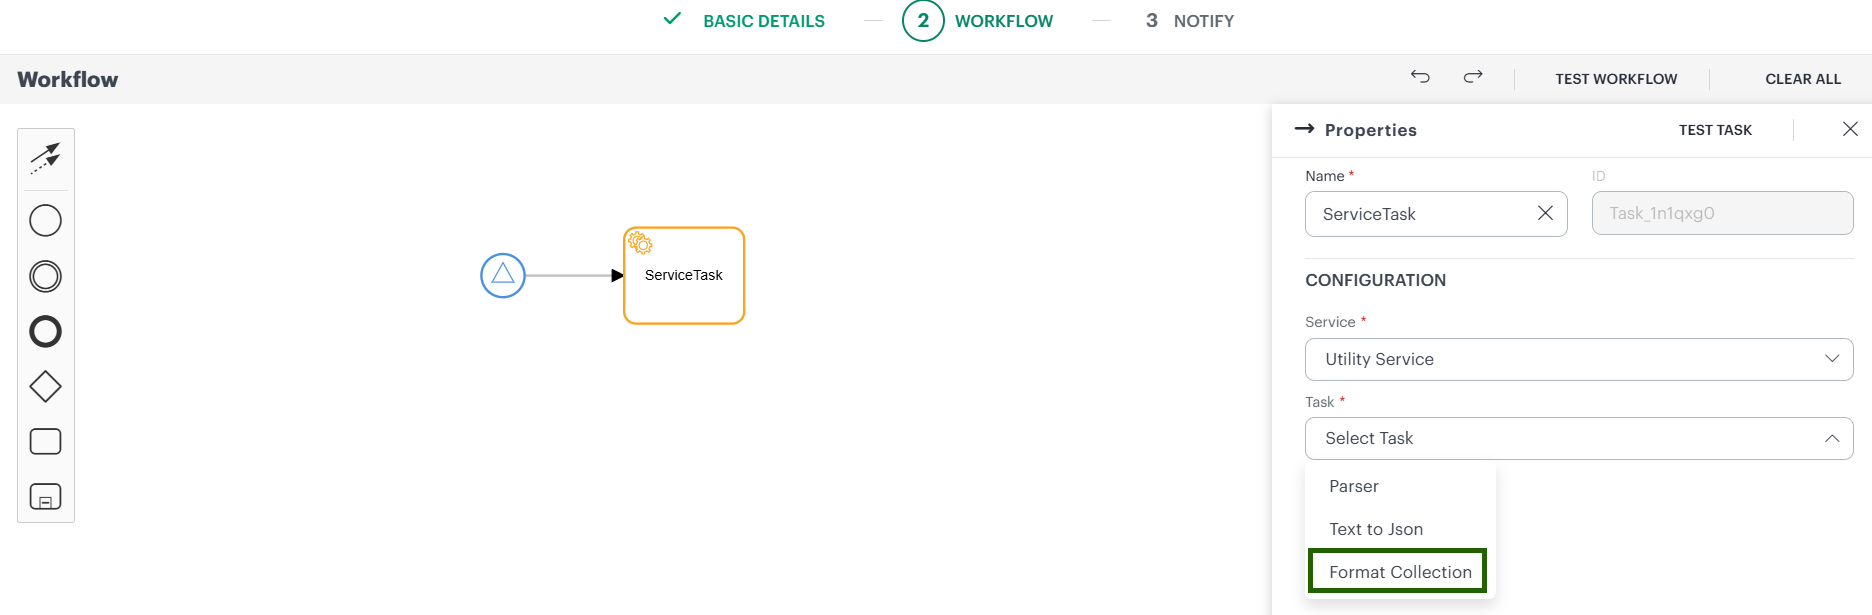
Added a Support for Format Collection utility service under Service Task Enhancement
Process Automation now supports a Format Collection utility service under Service Task. This feature enables users to extract and capture only the required data from bulk collection outputs and format the results into supported output types such as HTML, Plain Text, and JSON.
Benefits
- Enables users to capture only relevant data from large collection outputs.
- Reduces data noise by filtering and formatting required information.
- Supports multiple output formats (HTML, Plain Text, JSON) for flexible data usage.
- Improves readability and usability of automation outputs.
- Supports parallel and sequential multi-instance execution for enhanced workflow flexibility.
Workflow Traversal Path Visualization Enhancement
Process Automation now provides visibility into the workflow traversal path for both running and completed workflow instances, similar to the Test Workflow run view.
This helps users clearly understand execution flow, including gateway condition paths, without manually reviewing the Activities table.
See Running Instance for more information.
Tracing
Tracing UI Enhancements Enhancement
Implemented usability enhancements to the tracing service pages:
- Synchronized Time Selection: Brush selection on metric charts updates the global date filter across all views.
- Persistent Operation Details: Operation detail panel persists across view switches and outside clicks.
- Contextual Trace Filters: Trace filter dropdowns retain previously selected values when loading options.
- Optimized Query Performance: Resource API calls use a capped 60-minute time window for faster response times.
Reporting Apps
Metered Usage Report Enhancements Enhancement
The following enhancements have been made to the Metered Usage Reports:
- Revamped the Metered Usage Insights app for clearer and more consistent PDF and XLSX reports.
- The Overview tab has been redesigned with four focused summary tables (Resources, Metric-Series, Logs with ingested + retained size)
- Side-by-side layouts for usage trend graphs and tables.
- Top 10 breakdowns for
ResourceTypeandNativeType(weighted & unweighted) - Standardized formatting with consistent decimals, UTC timestamps, and updated terminology across the report
For more information, see Metered Usage Insights.
Enhanced Report Building Interface Enhancement
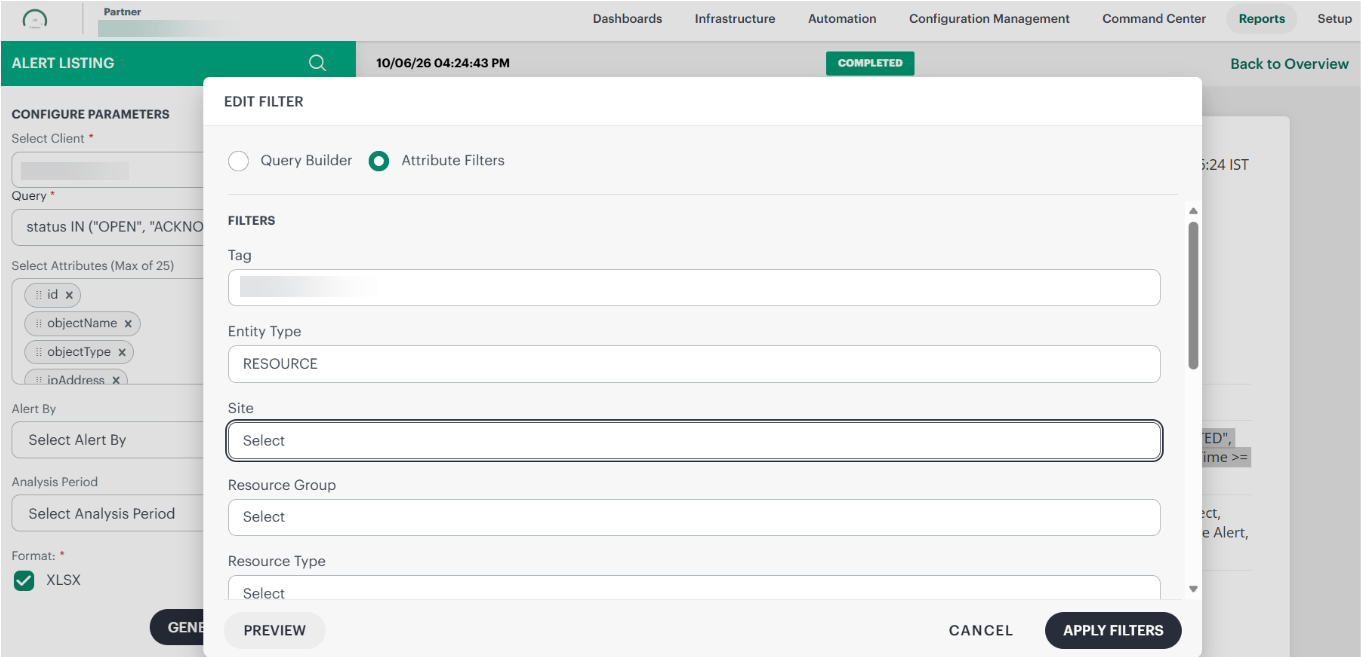
Users can now generate Alert Listing reports by utilizing the new filtering interface, which has been designed to simplify the process of selecting and applying filters. This enhanced interface makes it much easier and more intuitive for users to customize their reports according to their specific needs.
Within this interface, the Query filter provides two radio button options that appear in a popup window when the Query filter is clicked. This design allows users to easily switch between different filtering methods in a clear and straightforward manner.
Query Builder
By default, the Query Builder radio button is selected. It comes preloaded with a default query to help users get started quickly without needing to write their own queries from scratch. Users can modify the query based on their needs:
(status IN ("OPEN", "ACKNOWLEDGED", "TICKETED", "CORRELATED", "SUPPRESSED")) AND (createdTime >= '-7d')
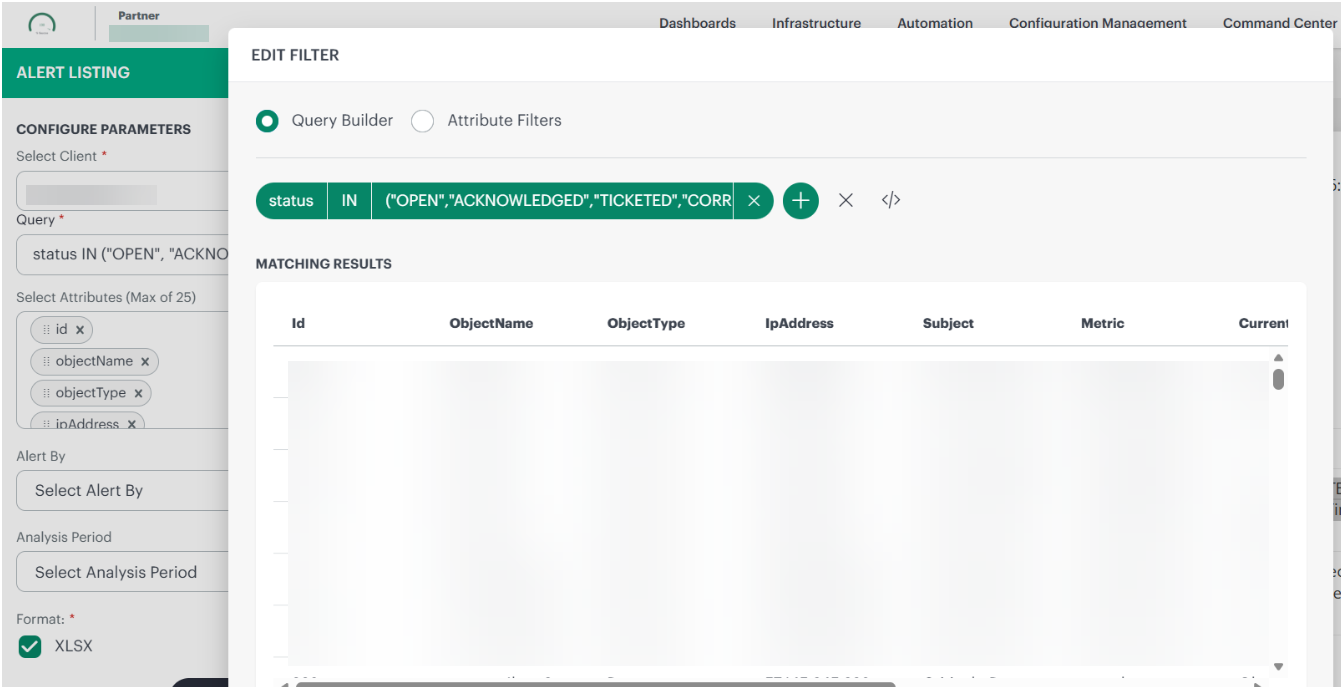
Attribute Filters
When users select the Attribute Filters option, the interface displays native filter dropdown menus. These dropdowns allow users to select attributes by simply checking the options they want, instead of having to write complex OpsQL queries manually.
This feature offers a preview option that allows users to view the matching results immediately after applying filters, enabling them to verify the data before proceeding to generate the final report.
For more information, see Alert Listing.
Public Cloud
AWS OpenSearch Monitoring Enhancements Enhancement
Introduced support for two new OpenSearch-related services:
- AWS OpenSearch Serverless (AWS/AOSS): Discover and monitor serverless collections with performance and health metrics.
- AWS OpenSearch Ingestion (AWS/OSIS): Monitor data ingestion pipelines and pipeline health.
These additions provide comprehensive visibility across different OpenSearch deployment models, enabling effective troubleshooting and capacity planning.
For more information, see AWS OpenSearch Service.
Support for AWS G2 Templates and Standardized Service Metrics Enhancement
AWS G2 generation templates now provide full support for G2 instance types with seamless metric collection. All existing AWS service metrics are standardized to align with official AWS CloudWatch documentation, delivering:
- More accurate data representation
- Improved consistency across monitoring dashboards
- Reliable view of AWS resources
These enhancements maintain full backward compatibility with existing integrations.
Amazon SES Monitoring Support Enhancement
OpsRamp now supports monitoring for AWS Amazon Simple Email Service (SES). Track delivery rates, bounce counts, and complaint rates directly in OpsRamp via CloudWatch metrics. This enables you to:
- Identify delivery anomalies proactively
- Monitor sender reputation health
- Manage sending quotas effectively
- Keep email workflows reliable and respond quickly to service health issues affecting deliverability.
Service Maps
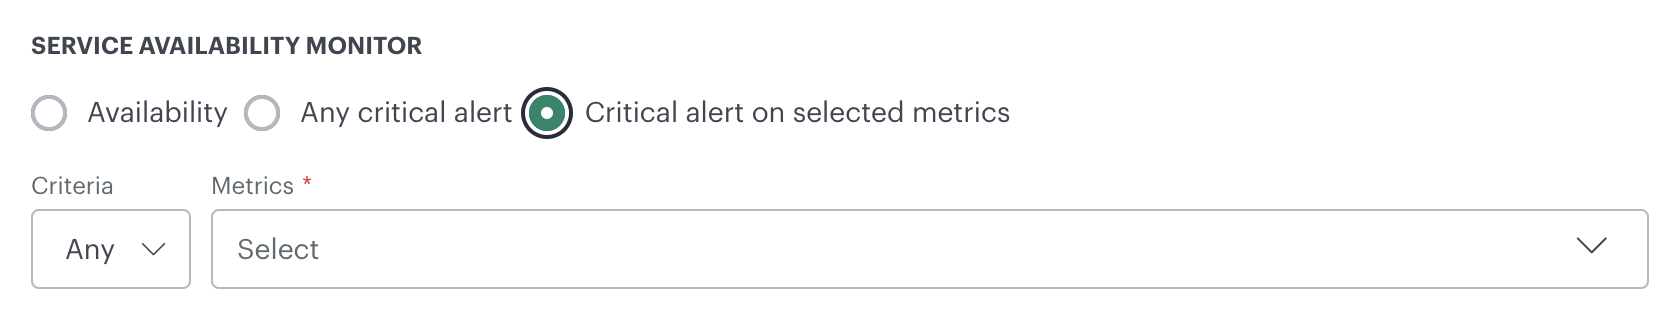
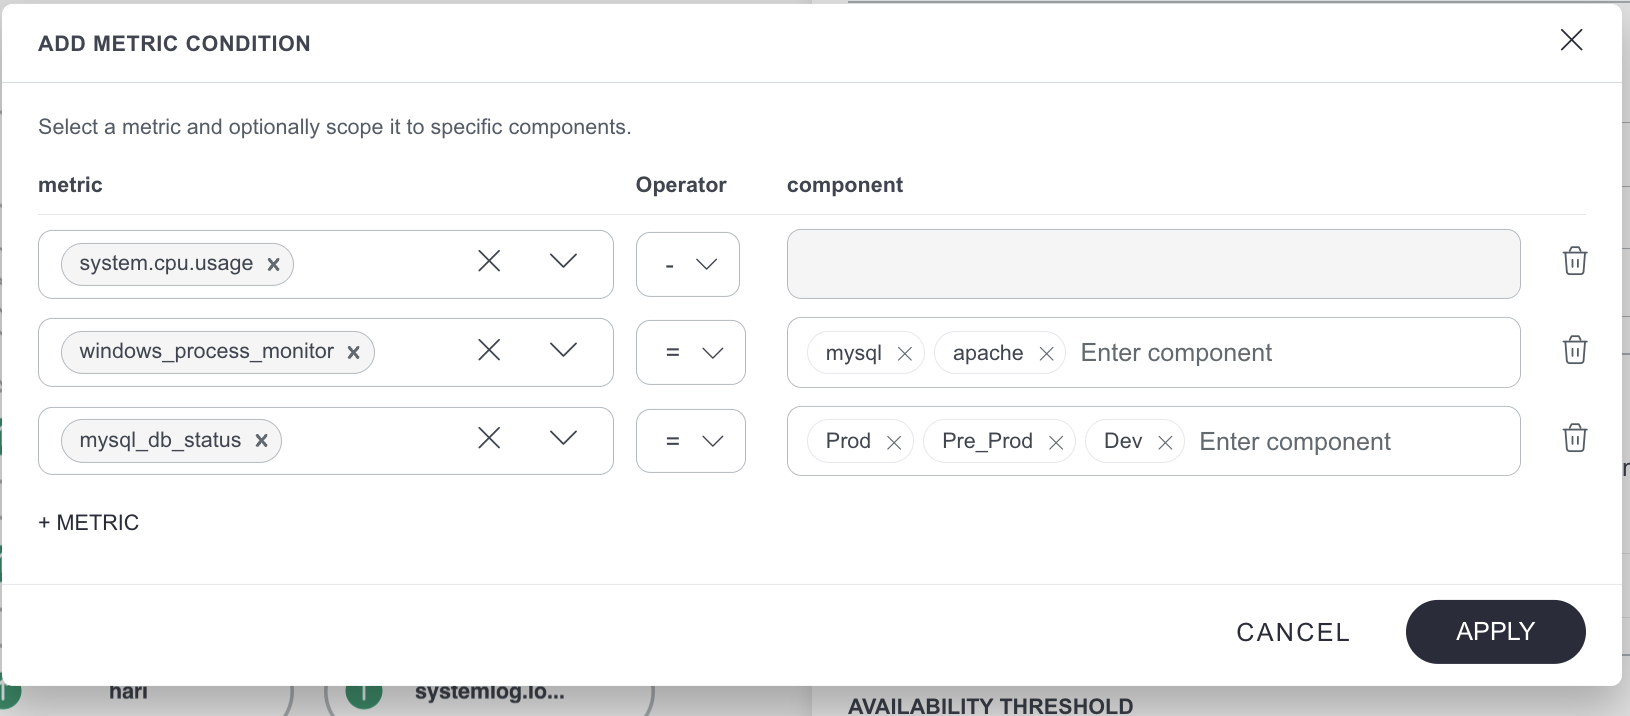
Support for Metric Component-level Filtering in Service Map Enhancement
You can now configure service map node availability using metric components, in addition to metric names. This enhancement allows you to define node status based on critical alerts for specific metric instances or components, rather than applying the condition to all instances of a metric.
As a result, you can achieve more precise and flexible monitoring, especially in scenarios where multiple components—such as disks, operating system processes, or network interfaces—share the same metric.
Collector Profiles
Gateway Commands now at Partner and Client levels Enhancement
You can now enable the execution of additional gateway commands via the agent at both the partner and client levels.
This enhancement extends the capability beyond service provider users, allowing you to manage and execute remote commands on NextGen gateways more flexibly across different organizational tiers.
This capability provides improved operational control and the ability to perform essential gateway maintenance and troubleshooting directly through the agent across your entire organization.
See Agent Remote Commands for more information.
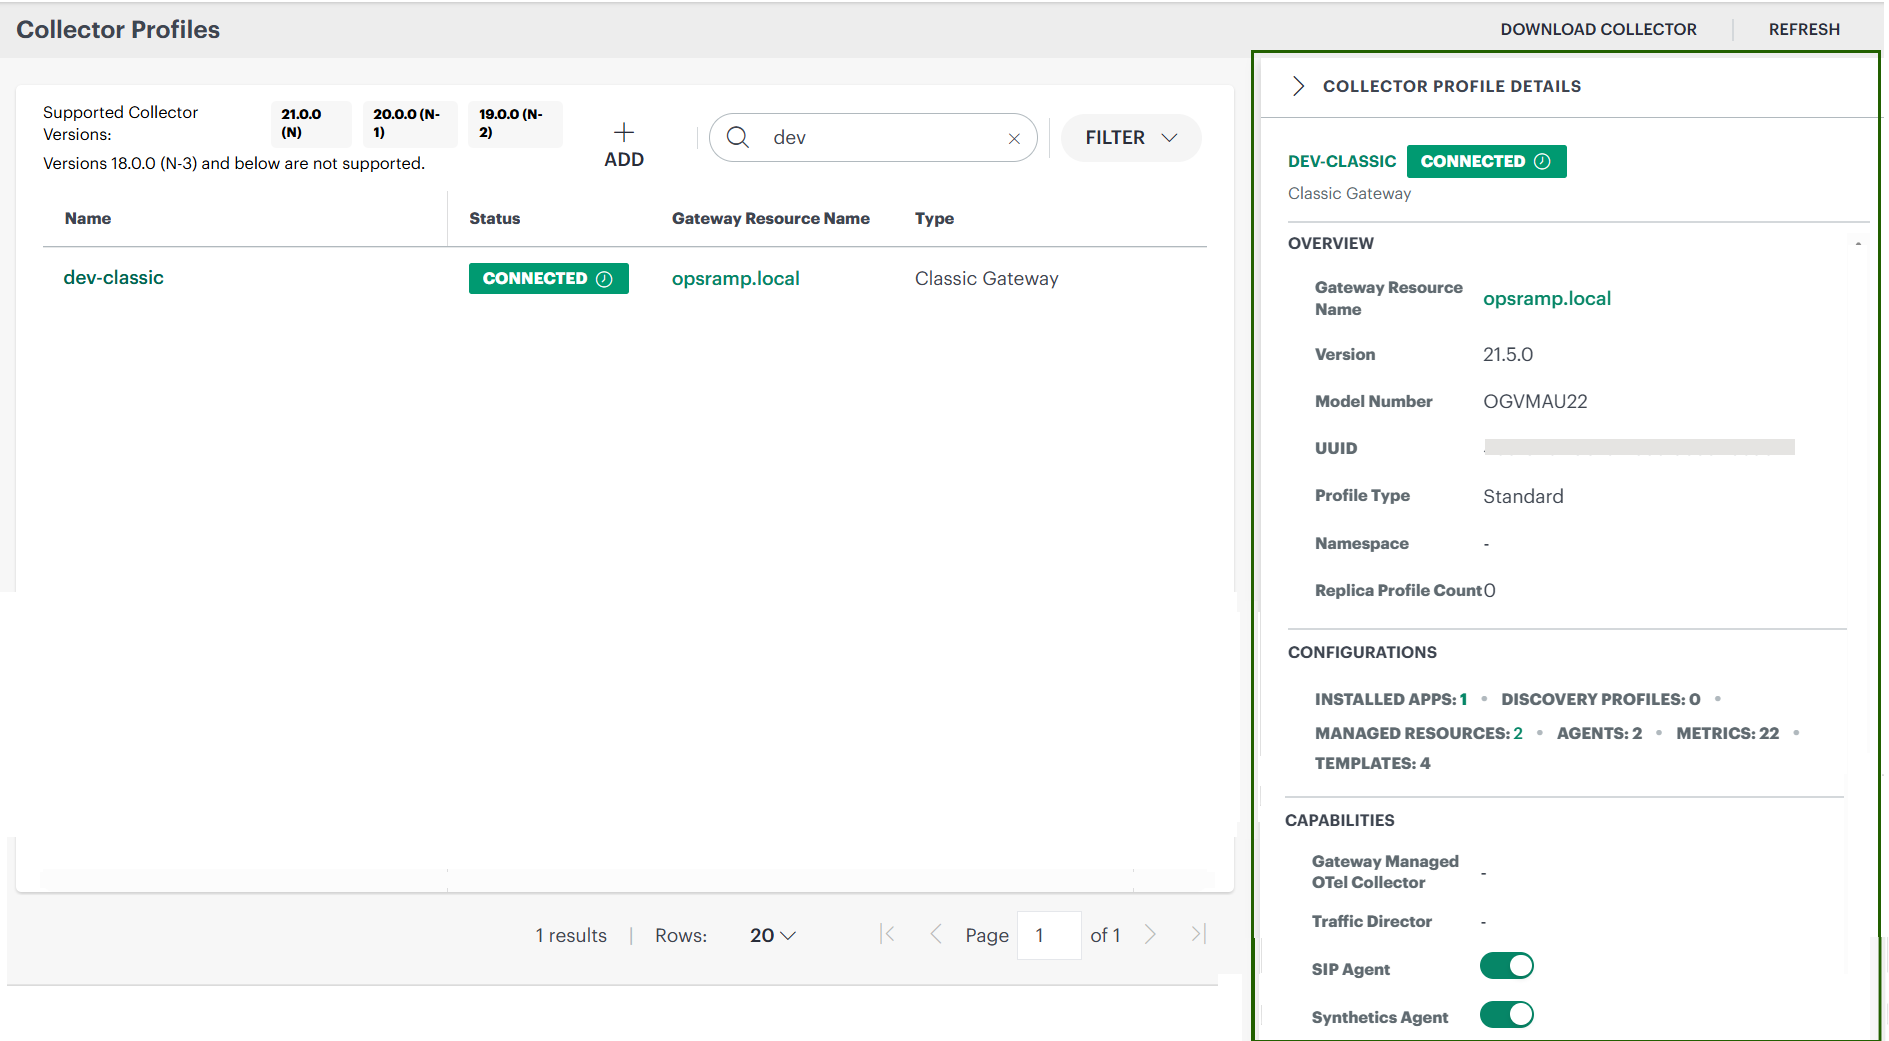
Enhanced Collector Profile Management Enhancement
You now get a more streamlined collector profile management experience:
- Cleaner listing: Collector Profile Listing now displays only essential columns to reduce clutter and improve readability.
- In-page details: A summary panel provides Overview, Configurations, and Capabilities without extra navigation.
- Better filtering: New filters help locate profiles such as model number, profile type, and upgrade state.
OpsPilot
Enhanced BYOLLM Provider Support Enhancement
Enhanced OpsPilot BYOLLM (Bring Your Own LLM) functionality with expanded support for additional providers. This update introduces support for AWS (Cloud-Based), Azure Foundry (Cloud-Based), and OpenAI (Direct API), enabling greater flexibility in selecting LLM providers based on customer requirements.
For more information, see Supported LLM Providers.
Updates in Upcoming Release
Metric Limit in the Service Map Node configuration
You will soon see a limit on the number of metrics that can be configured for service map resource node availability. Currently, you can configure an unlimited number of metrics; however, this will be restricted to a maximum of 5 metrics per node configuration.
This change will take effect in approximately August 2026 release and is intended to improve performance and overall configuration efficiency. After the August 2026 release, you will be limited to adding a maximum of five metrics.