Dashboards
Dashboards as PDF export
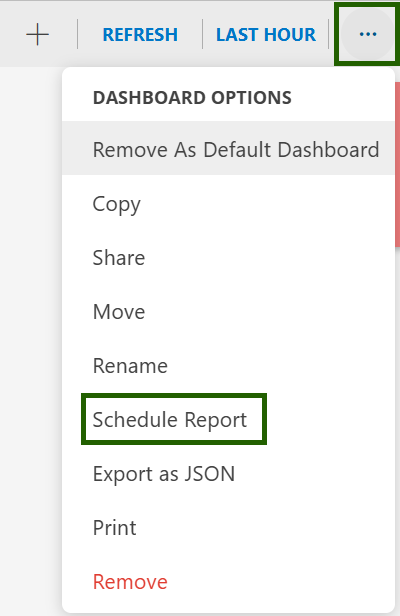
Users now can generate the visible Dashboard instance download as PDF which could be used for executive summary report. These exports can be scheduled to send to client users.
Copy tile
Copying a tile having queries using variables is now supported by this release which will automatically account for variables getting created in the destination dashboard.
Resource Management
Improved Visibility and Navigation in SDK Apps Enhancement
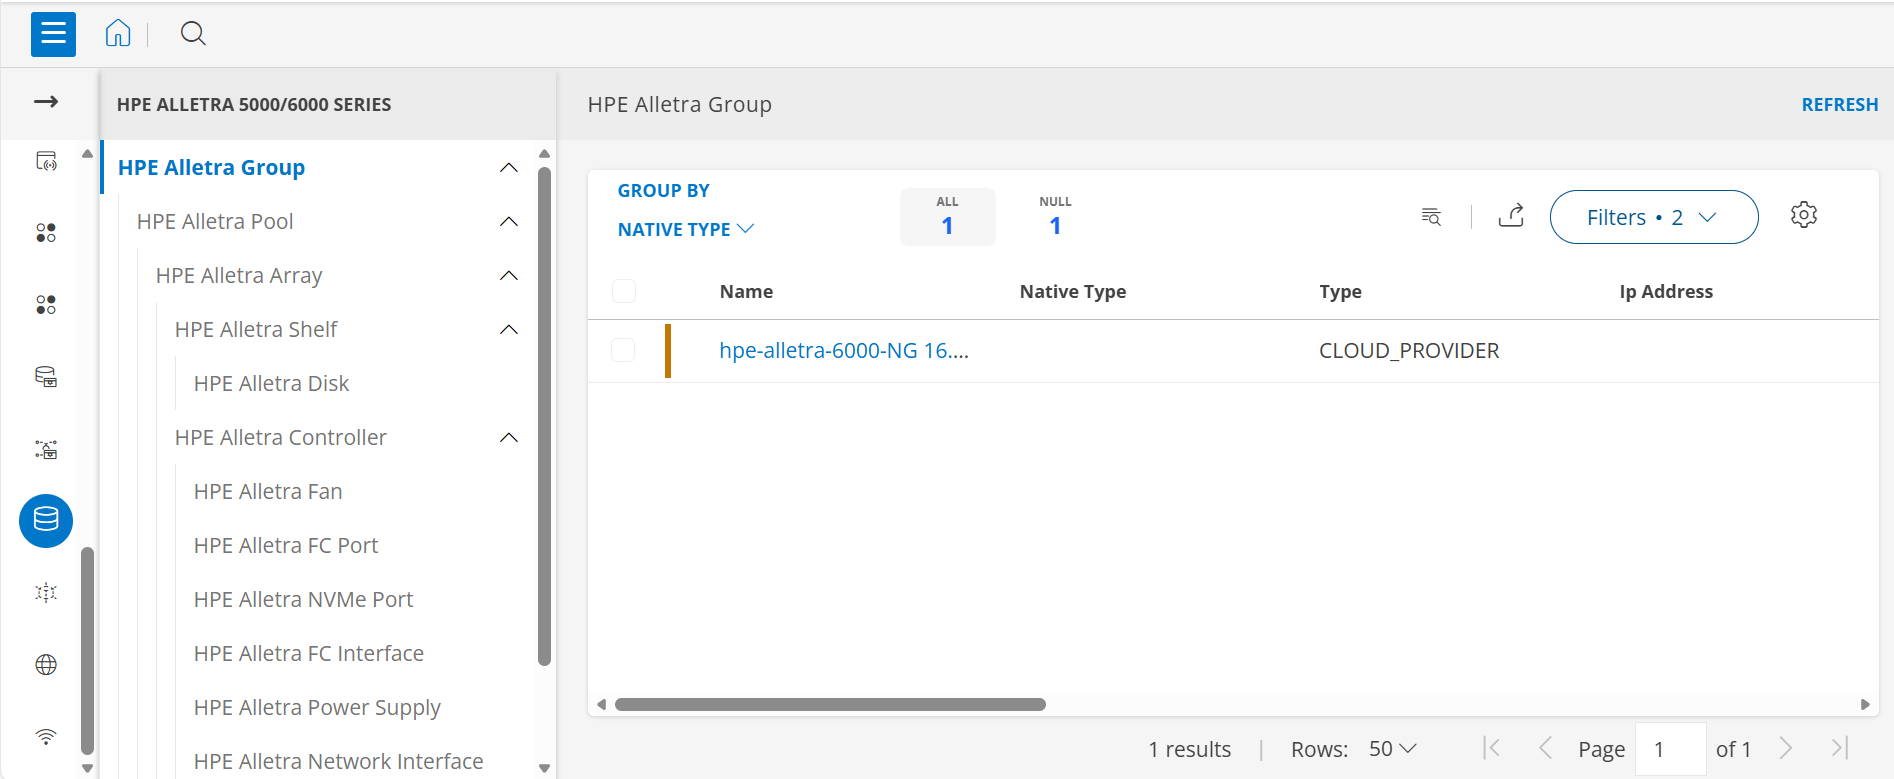
You can now view SDK resources in a hierarchical tree structure, organized by their native types. This intuitive layout provides a clearer, more structured overview of your resources, making navigation and management faster and more efficient.
Key Benefits:
- Clearer Insight into Resource Relationships: Understand how resources are connected with improved structural visibility.
- Easier navigation through SDK apps having complex structure: Easily explore and manage intricate SDK applications with a more intuitive layout.
- Faster access to specific resource types: Locate and interact with resources faster through organized categorization.
The hierarchical tree structure is supported across the following SDK applications:
| IBM AIX | Nutanix Prism Central | VMware NSX-V | Redfish - Server | HPE Alletra 9000 |
| HPE Alletra 6K/5K | NetApp ONTAP | Hitachi VSP Opcenter Detailview | HPE OneView | HPE StoreOnce |
Event Management
Resource Native Type Filter Added to Alert Policies Enhancement
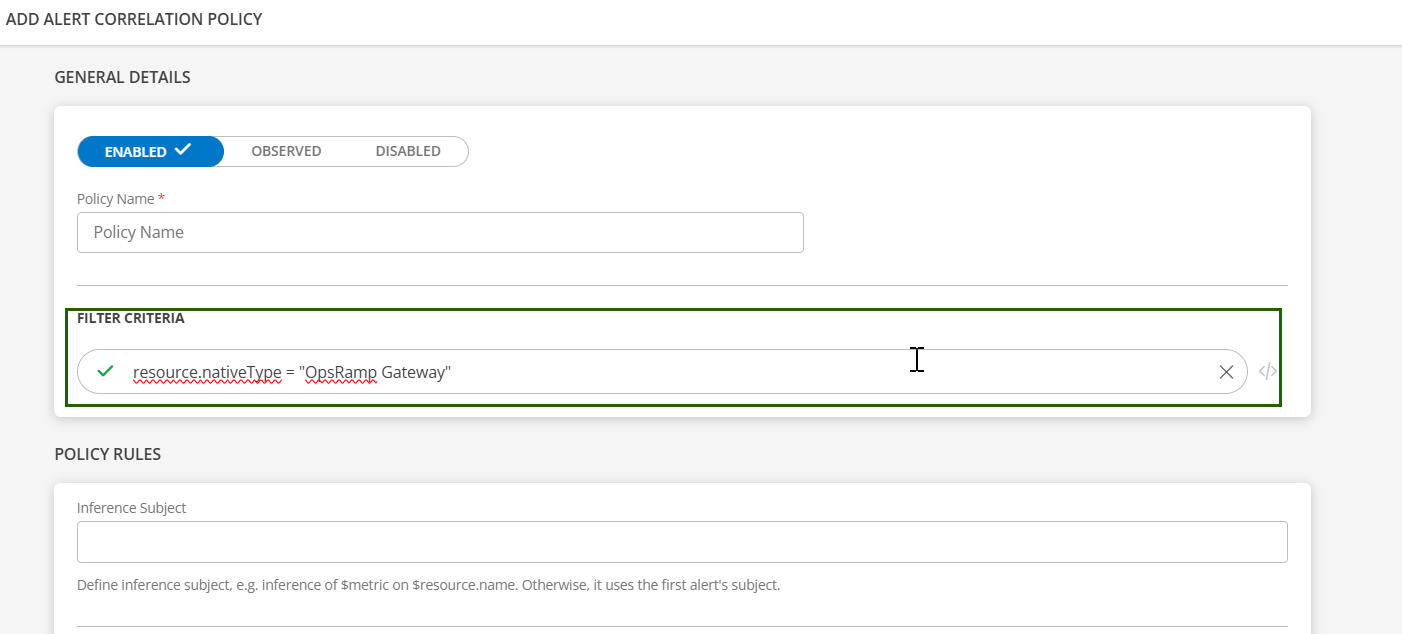
Alert Policies now support filtering based on resource native type, allowing users to create more targeted and accurate alerting rules. This enhancement helps users refine conditions so that policies apply only to specific resource categories, improving alert relevance and reducing noise.
Enhanced Incident Update: Customizable Subject and Description Enhancement
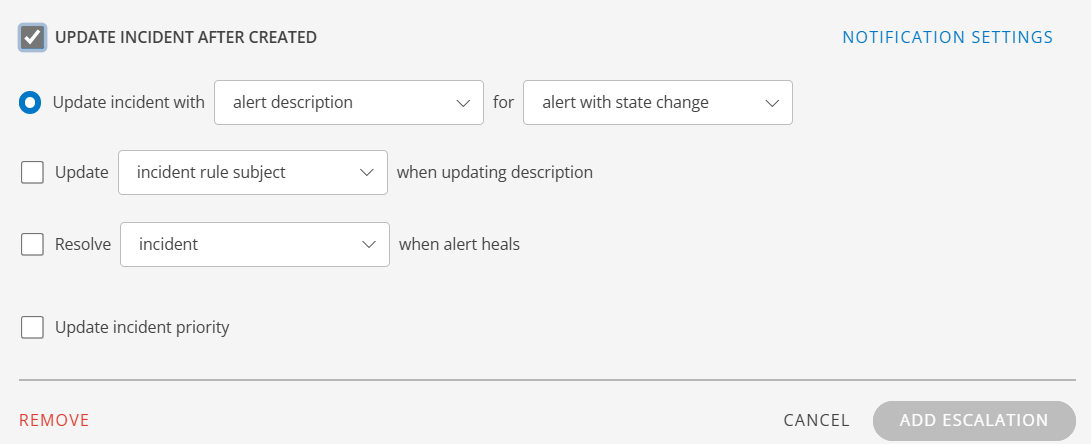
You can now customize the subject and description when an existing incident is updated through an alert escalation policy.
Multiple Executions for “Run Process” Action on Alerts Enhancement
You can now run the same or multiple Process Automation jobs on an alert more than once. Up to 10 processes can be selected, and custom input values can be updated before execution. The Comments field is now optional. A process can be re-run after a 5-minute gap from the previous run or if the process definition has been updated.
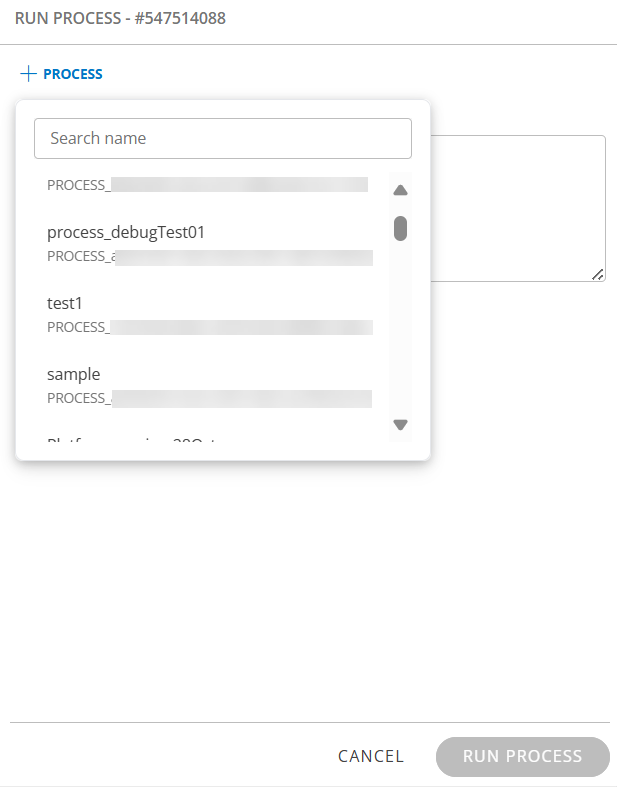
See Run Process for more details.
Log Management
Support for Stream Export Integration at partner level is removed Enhancement
OpsRamp no longer supports Stream Export Integration at the partner level. You can stream alerts only at the partner level, while the logs only at the client level. Clients who require Stream Export Integration must enable log monitoring and configure the integration at the client level.
Monitoring Management
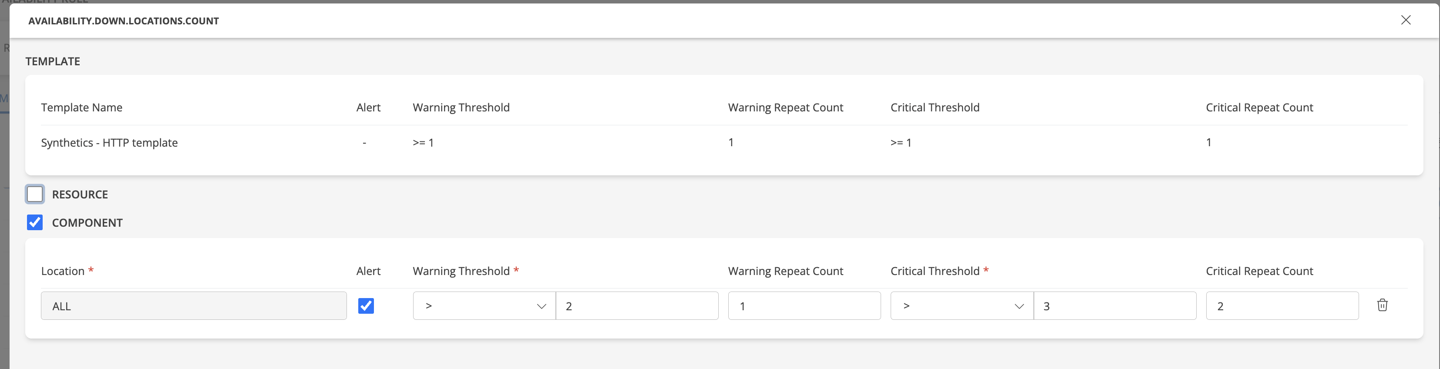
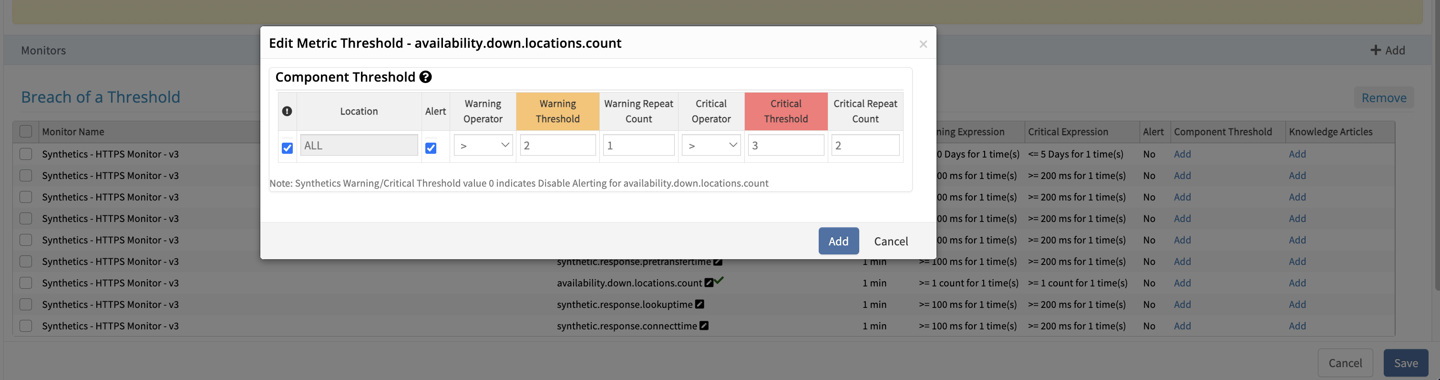
Synthetics “availability.down.locations.count” Metric Component Thresholds Correction Enhancement
OpsRamp only supports the ALL option in the Component threshold field for the metric availability.down.locations.count in the Synthetics template. This also applies to Resource Component Level thresholds. If you have configured this metric using any option other than ALL, alerts may not function as expected. You need to update the Component/LOCATION field to ALL to ensure proper alerting behavior.
Reporting Apps
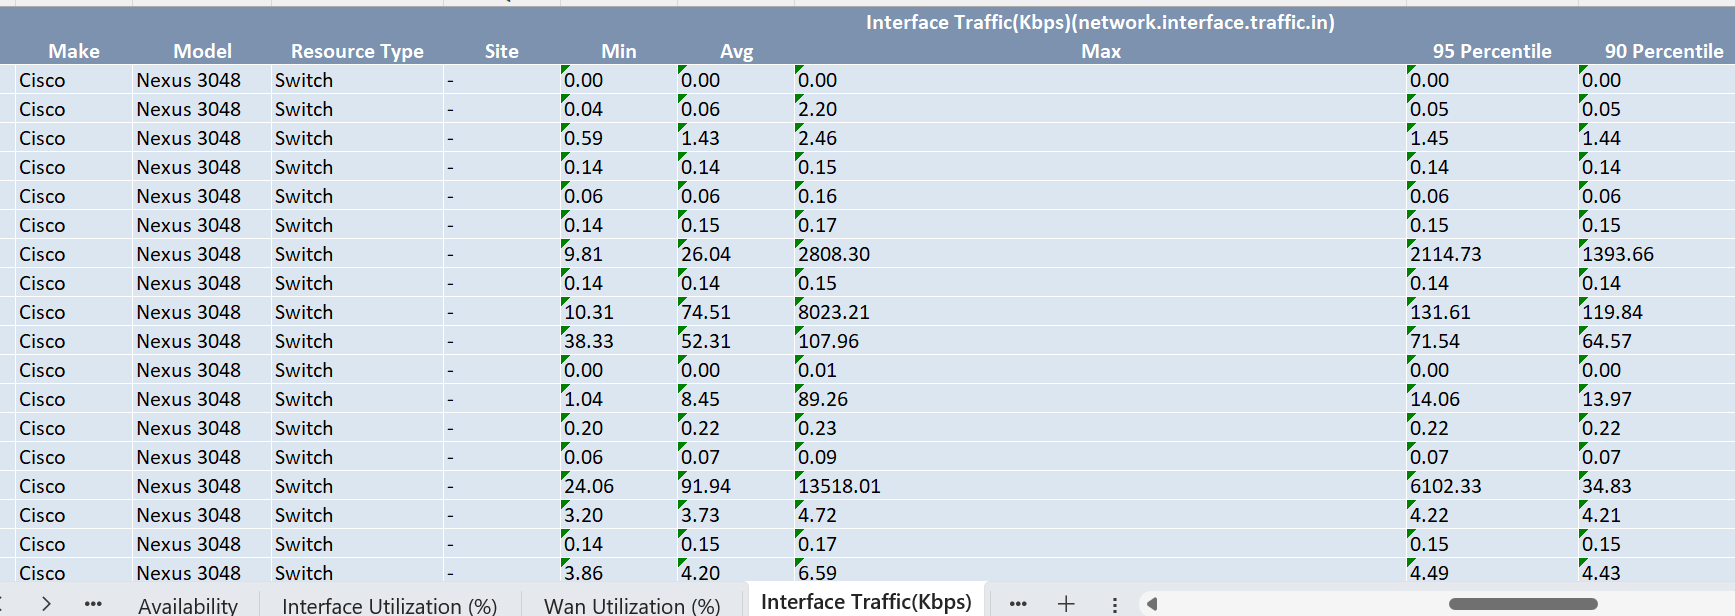
Support 90/95 percentile in Network Utilization App
The Network Utilization App has been enhanced to include support for tracking the 90th and 95th percentiles of network utilization metrics.
This feature allows users to better understand and analyze network performance trends over a specified period, providing insights into high utilization levels that may affect overall network efficiency.
By monitoring these key percentiles, users can identify potential bottlenecks and make informed decisions to optimize their network resources. And provided the support of interface configure speed attribute in the report.
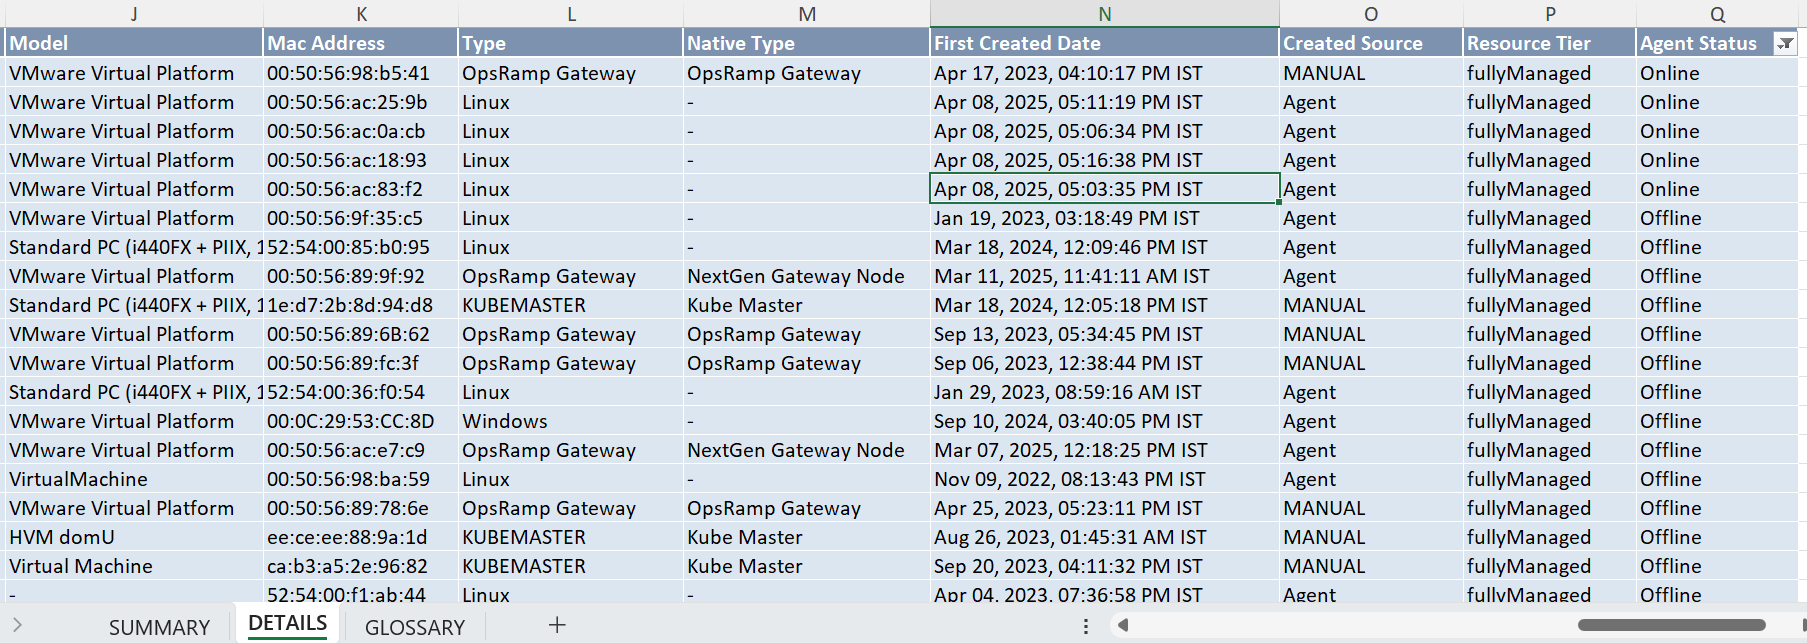
Asset Inventory App Improvements
The Asset Inventory app now includes support for agent status and the timestamps associated with unmanaged resources.
This enhancement allows users to easily filter and organize their resources based on the current status of resource agents, as well as the specific timestamps indicating when resources became unmanaged.
With these new filtering options, users can more effectively manage their resources, ensuring better oversight and control in their operations.
And included below attributes in the attributes section as default attributes.
- Partner Name.
- Resource Type Display Name.
- Resource Tier.
Metered Usage App Improvements
The Metered Usage Insights report now tracks consumption based on native resource types instead of generic resource types. Users can view a detailed consumption breakdown by weighted, unweighted, and integration categories in the Resource Breakdown section.
Public Cloud
Cisco Intersight Integration - New Monitoring Template for Fabric Interconnects Enhancement
A new monitoring template Cisco Intersight Fabric Interconnects G2 has been added to improve visibility into the hardware health and operational status of Cisco Intersight Fabric Interconnect (FI) devices. This enhancement resolves earlier gaps related to missing FI templates, device naming inconsistencies, and accessibility issues. The updated templates enable more comprehensive observability and proactive monitoring of FI hardware components.
New Metrics Introduced:
- Fabric Interconnect Alarms Count – Reports the number of active alarms on the device.
- Fabric Interconnect Health – Indicates the overall health and operational status.
- Fabric Interconnect Thermal Status – Monitors temperature and thermal conditions to identify potential overheating.
See Cisco Intersight for more details.
Synthetics
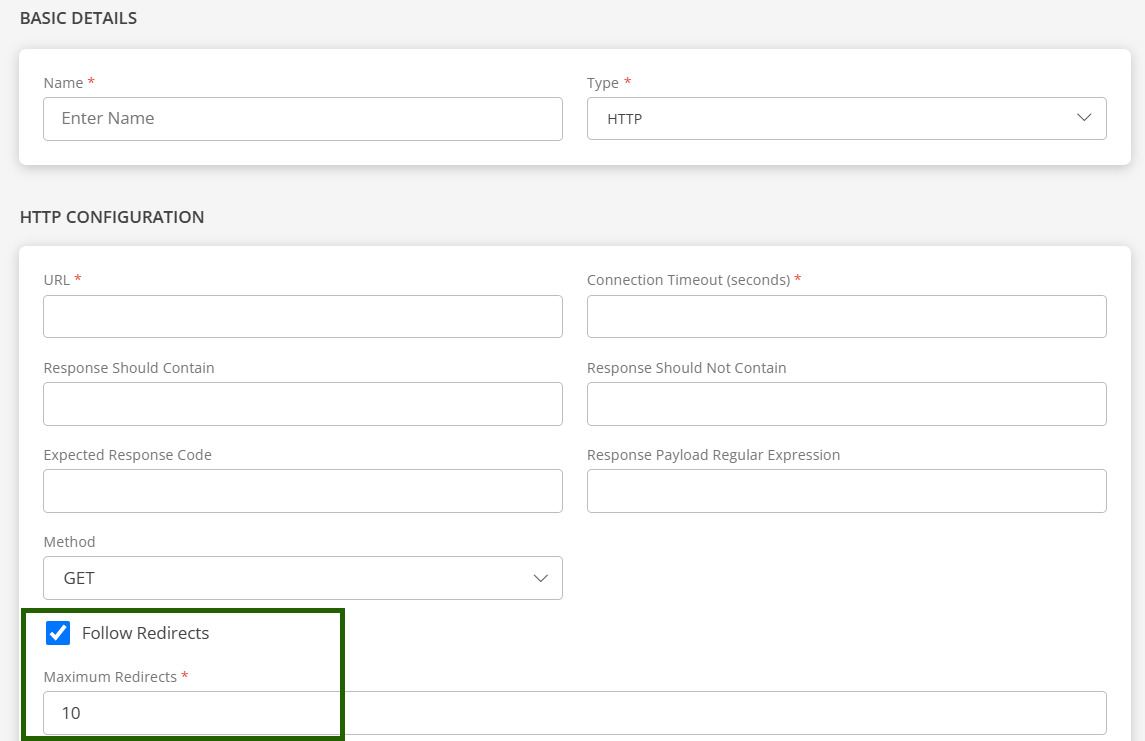
Added “Follow Redirects” Option for HTTP/HTTPS Configuration Enhancement
Introduced a new Follow Redirects option in the HTTP/HTTPS Configuration page. When enabled, users can configure redirect behavior and define the maximum number of redirects between 1 to 50.
Note: This changes is applicable from Gateway version 20.1.0.
Agent
Tag-Based Agent Update Grouping Enhancement
Enhanced Filtering and Tag-Based Grouping for OpsRamp Agent Updates which supports for both Windows and Linux OS Integration Apps.