Introduction
The Metric-based Alert Definitions feature in OpsRamp empowers IT operations teams to proactively monitor infrastructure, applications, and services by setting precise alert conditions based on metrics. It leverages PromQL (Prometheus Query Language), a robust and flexible language built for querying time-series data.
By creating Metric-based alert definitions, you can set alerts to trigger when certain thresholds are exceeded, anomalies arise, or specific patterns appear in your monitoring data. This proactive approach enables the early detection of potential issues, allowing teams to respond swiftly and minimize the impact on users and service performance.
Permissions
Following are the permissions required to perform various tasks.
| Category | Permission Type | Permission Value | Task |
|---|---|---|---|
| ALERTS | Alerts | View | To view the Alert Definitions listing screen. |
| Alerts | Manage | To manage alert definitions (create, update, delete) and perform related actions. |
Note
- The maximum number of alert definitions that can be created per client is 50.
For any queries or assistance, contact OpsRamp Support. - The alert definition can currently be defined at the client level.
Labels
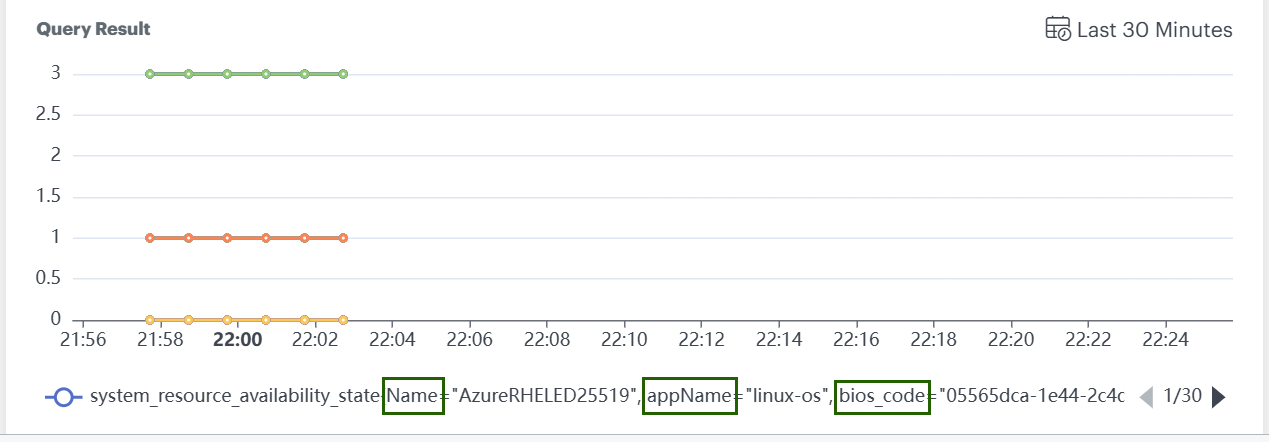
- Each metric has a unique set of labels (e.g.,
Name,appName,bios_codeas shown in the graph below) represented as a single line in a graph. If a new label is added or a label value changes, it appears as another line in the graph. - Some PromQL queries return only values without indicating which set of labels those values belong to.
- Alert definitions will not trigger alerts for queries that do not contain labels, even if the metric values breach the configured thresholds.
Key Points
- Queries must include labels for alert definitions to function properly.
- Threshold breaches on label-free queries will not generate alerts.
- Ensure all alert queries specify appropriate label selectors to enable alert triggering.
Create an Alert Definition
Follow these steps to create an alert definition:
Navigate to Setup > Account. The ACCOUNT DETAILS screen is displayed.
Click the Monitoring tile.
Select METRIC BASED under Alert Definitions.
Click +ADD.
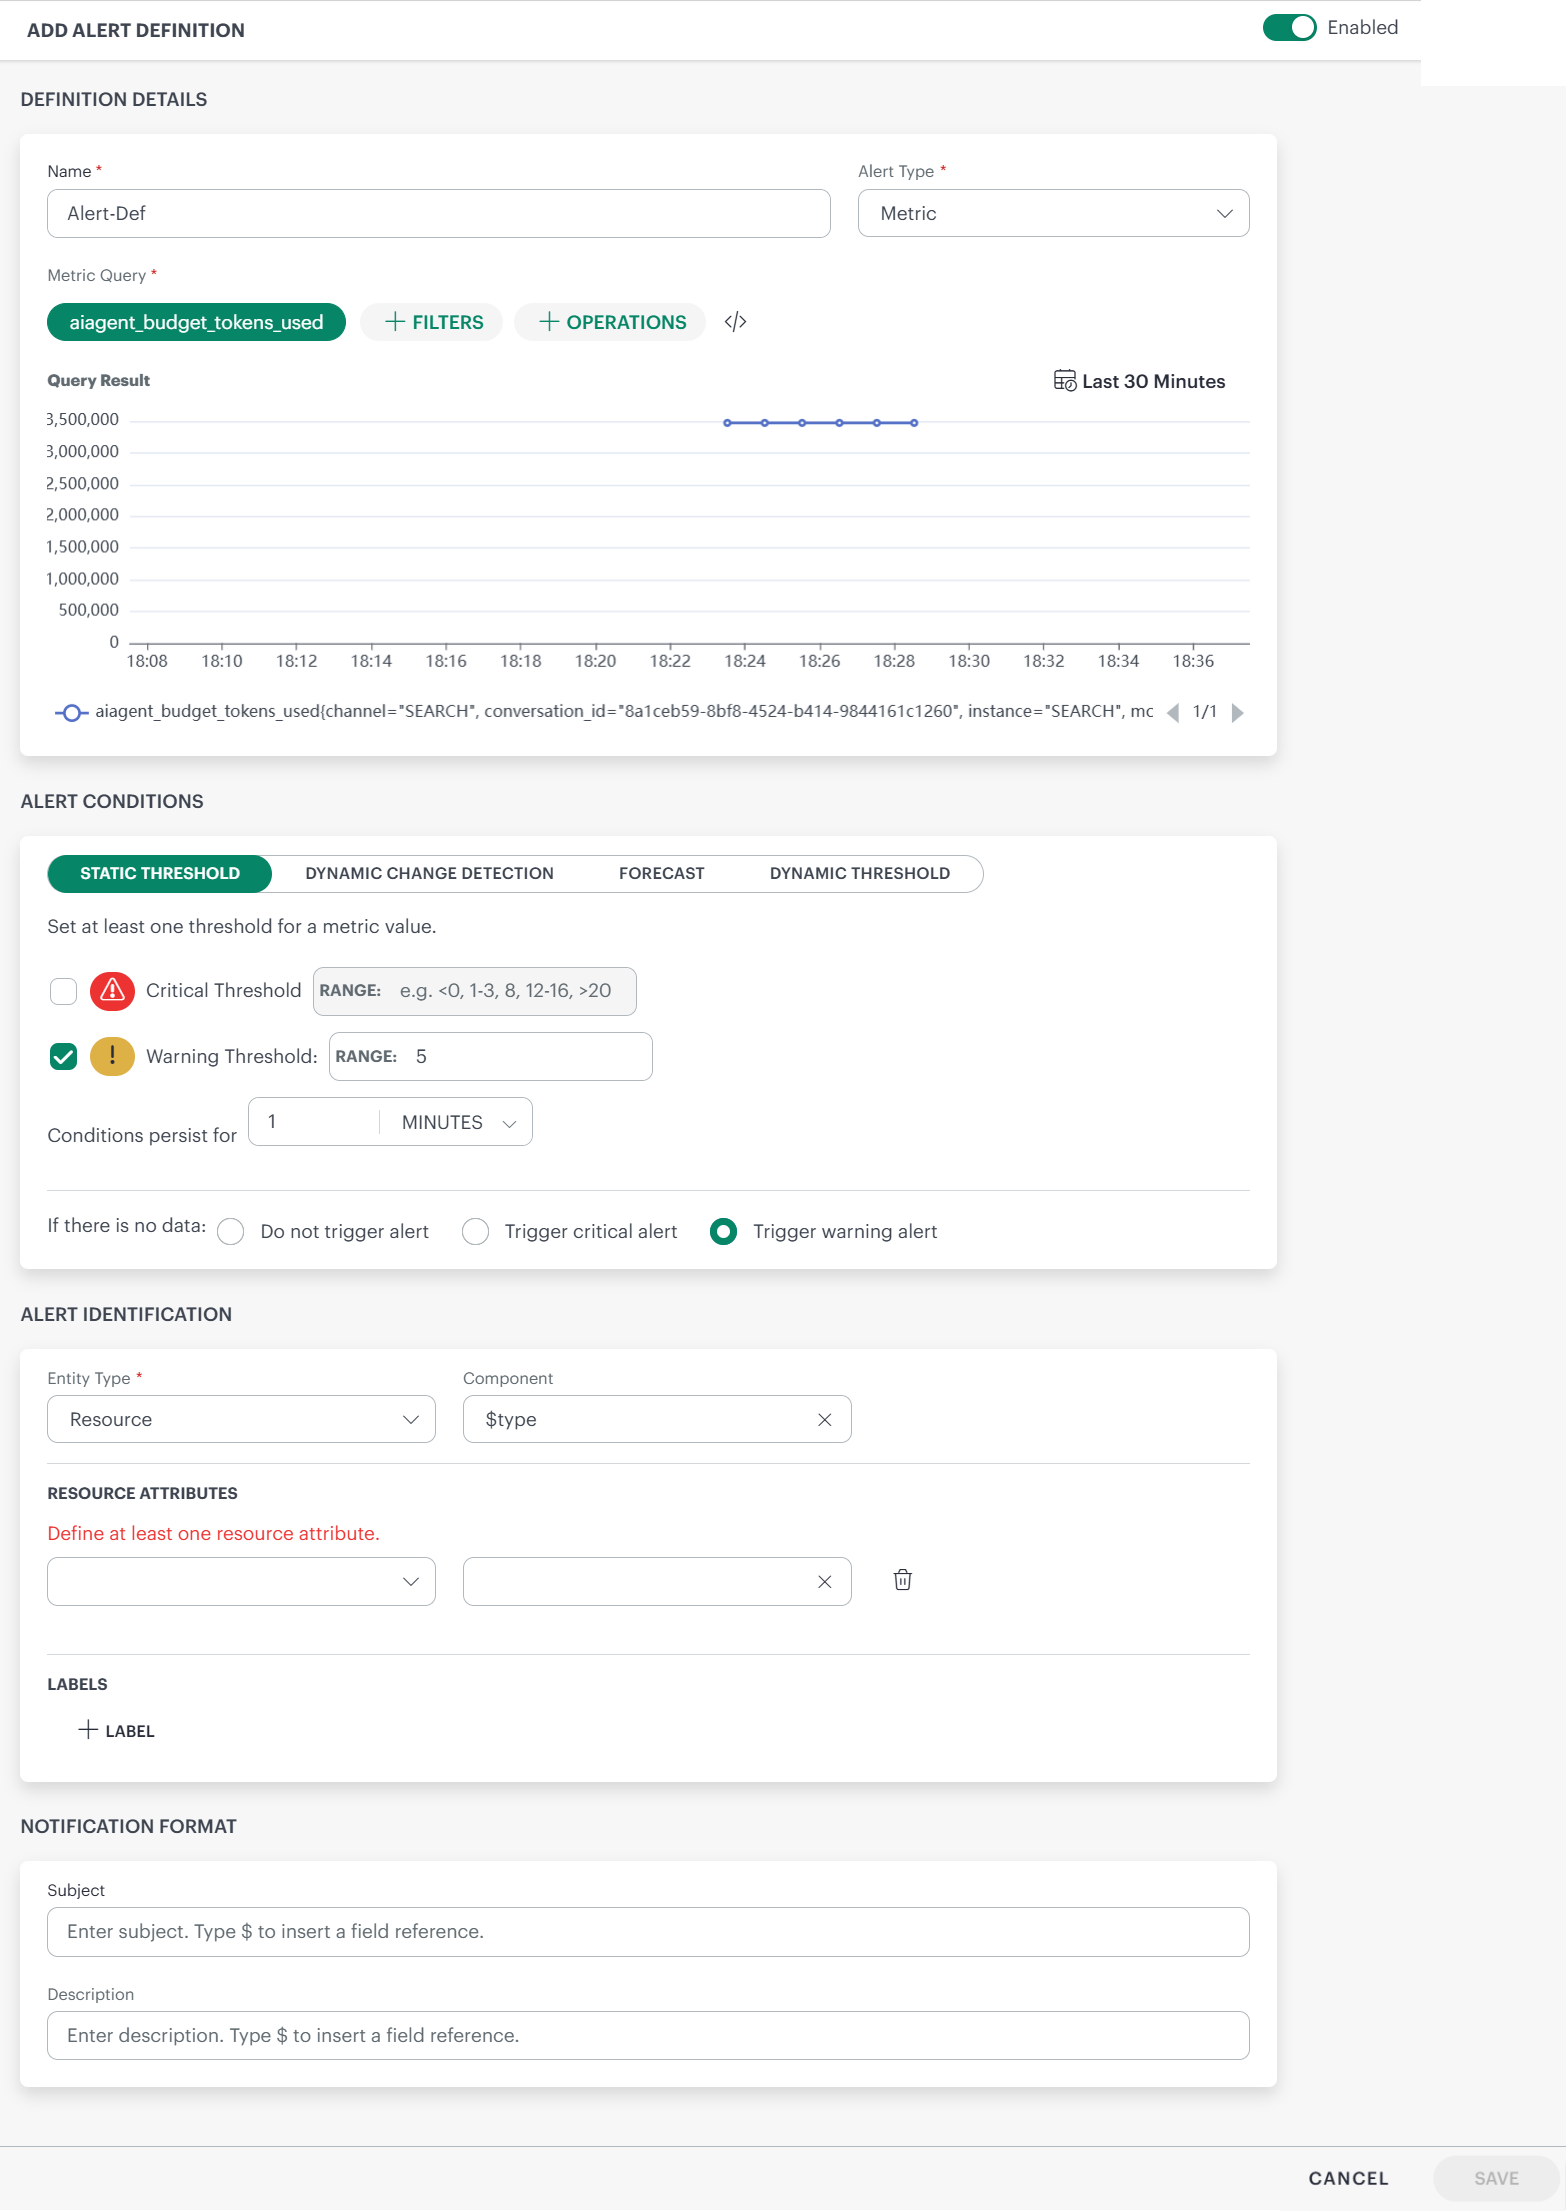
Enter the following information in ADD ALERT DEFINITION screen:
Name: Provide a unique name for the alert definition.
Alert Type: Select Metric or Trace as alert type.
Note: If Trace is selected, the alert type will be Trace, though you provide a metric query.Metric Query: Build a valid PromQL query using a metric. Use the filters and operations for the query as needed.
Examples:system_cpu_utilizationsynthetic_response_time{name="1 HTTP"}avg_over_time(alert_escalation_policy_count2{groups=~".*,device_group,.*"}[5m])
See PromQL for more information.
You can change the time-frame using the calendar icon.
The query result (time series) is displayed in the form of a graph.
- Critical Threshold: Enter a critical threshold value. Enter a single value or a range.
Note: You can specify negative values as thresholds.
Examples: 5, -5, =-5, 5-6, -6-6, -9--6, <5, <-5, <5, <=-5, !=-5, !=5 - Warning Threshold: Enter a warning threshold value. Enter a single value or a range.
Note: You can specify negative values as thresholds.
Examples: 5, -5, =-5, 5-6, -6-6, -9--6, <5, <-5, <5, <=-5, !=-5, !=5
You can set both critical and warning thresholds or set only one threshold based on your requirements. - Conditions persist for: To avoid anomalous spikes, you can set a condition for an alert to trigger only if the metric value exceeds the thresholds persistently for some time.
The default time is set as 1 minute.
Value must be within the range of 1 to 60 minutes.
Example:
The above screenshot shows the latest data point as 53.2. If the metric value is above the threshold for 1 minute continuously, only then is the alert triggered.- Set the critical threshold as 50 and warning threshold as 40.
If the metric value reached 80 and came back to 45, then a warning alert will be triggered.
- Set the critical threshold as 50 and warning threshold as 40.
- If there is no data: If there is no data coming in, then you can choose one of the options:
- Do not trigger alert - No alert will be triggered, if no data comes in.
- Trigger critical alert - A critical alert will be triggered if no data comes in.
- Trigger warning alert - A warning alert will be triggered, if no data comes in.
- A No Data alert is triggered only after metric data has been received at least once, followed by a continuous 30-minute period with no data.
- If the alert definition is created when no metric data exists, the alert will not trigger.
- The No Data alerts are generated at the client level, based on the corresponding alert definition.
- increase, decrease, or increase or decrease of more than:
Default is set as 5 (Values should be between 1 and 10) standard deviations away from the mean is detected.
-- Value falls below a lower threshold (optional)(Based on the metric value enter the lower threshold, decimal or integer) to exceeds upper threshold (optional) (Based on the metric value enter the upper threshold, decimal or integer) -- the conditions persist for 5 (default) MINUTES. -- Evaluate the data over a learning period of the last 4 HOURS (values should be between 1 and 8 hours). - Condition: Increase
- Standard deviation threshold: 5
- Value exceeds threshold: 90% (optional upper limit)
- Persistence duration: 5 minutes
- Learning period: Last 4 hours
- Provide the information in the fields.
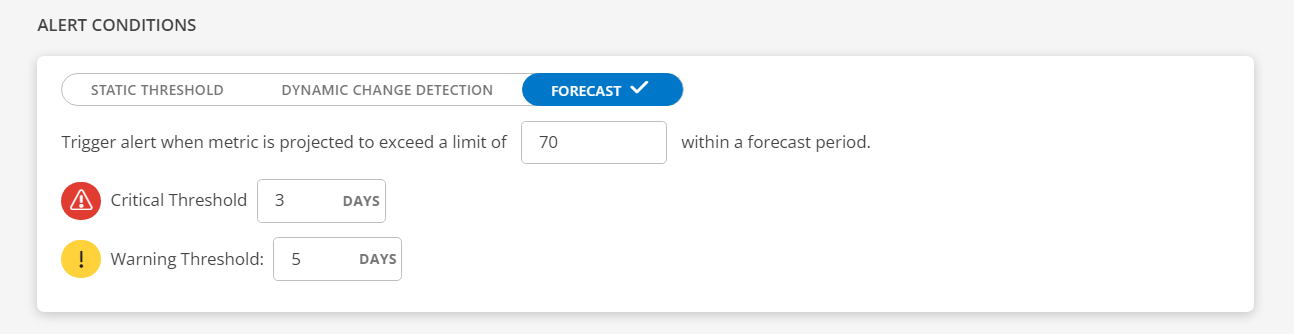
Limit: This feature monitors specific metrics and triggers an alert when the projected value of the metric is forecasted to exceed a predefined limit within a specified forecast period.
The limit is a metric unit and predefined limits are set for each metric, determining the acceptable range. For example, CPU usage from 1% to 100%, disk space from 1KB to 100GB, network speed from 1Bps to 1Gbps (enter a non-zero positive integer).Critical Threshold: Enter a critical threshold value. Enter a number.
Example: 3 days
Warning Threshold: Enter a warning threshold value. Enter a number.
Example: 5 days
How it works: It will predict the occurrence when the specified limit is about to be reached and trigger an alert based on the timeframe specified in the critical or warning threshold.
The forecasting process will occur once daily starting from the creation of the alert definition. Note: Operations are not supported while building a query. - Subject: Enter subject for the alert.
Note: Enter$to add tokens.
Example: The alert is on the resource with host name: host - Description: Enter alert description.
Note: Enter$to add tokens.
Example: The alert is on the resource with IP: IP
These tokens are displayed only after you provide a metric or a query in the Metric Query field. - Entity Type: Select either Resource or Client. Alerts can be on a specific resource like a server, or a client-level alert.
Note: For Dynamic Change Detection, you can select the Entity Type only as Resource. - Component: Select a component. This is to identify the alert.
- Resource Attributes: Define a resource attribute to the alert. These attributes are added to the alert.
Note: The resource attributes can be defined only for Resource entity type.- Select the attribute key and the attribute value from the dropdown boxes. These attributes can be seen in the alert details. Note: The maximum number of attributes you can select is 4, that is, host, name, UUID, and IP.
If you select the attribute value as $name, it will go to the metric and get the value of name and display it in the alert details screen. - Labels: Assign a value to a label. This is reflected in the alert details screen.
- Enter the name of the label in the Name box.
- Enter the value of the label in the Value box. Example: If name is id and value is 10, then it will be set as id is 10.
Alert Conditions
Static Threshold
The Static Threshold feature allows you to set thresholds for a metric value. You can also set conditions based on which the alerts are triggered.
Dynamic Change Detection
The Dynamic Change Detection feature allows you to set up intelligent alerts based on statistical deviations from normal behavior in time-series data. This is especially useful for detecting anomalies that deviate significantly from historical trends.

Trigger alert when:
How it works: The system analyzes the last 4 hours of time series data (default value, adjustable between 1 and 8 hours) to calculate the mean and standard deviation.
An alert is triggered when the metric value deviates significantly from the mean, breaches the defined thresholds, and the condition persists for the configured duration.
Example: Let us say you are monitoring CPU utilization on a server. Following are the criteria you configured for the alert:
If the CPU usage suddenly spikes to 95% and stays above that level for at least 5 minutes, and that value is more than 5 standard deviations above the historical average, the system will trigger an alert.
Forecast
The forecasting typically refers to predicting or estimating potential issues or events that might trigger an alert. This involves analyzing historical data, patterns, and trends to anticipate situations that could lead to issues or other predefined conditions.
Notification Format
The Subject and Description entered here will reflect in the alert details screen.
Alert Identification
The alert identification section defines the scope of the alert.
Dynamic Threshold
If you do not want to manage threshold values manually, you can opt for Dynamic Threshold, which automatically adjusts threshold settings based on your data.
Dynamic thresholds automatically calculate alert boundaries for each metric series returned by your PromQL query, adapting to your system’s actual behavior over time.
Use dynamic thresholds when:
- Your metrics have seasonal or cyclical patterns (e.g., higher CPU during business hours).
- You monitor many similar resources that each have different baselines.
- You want alerts that reduce noise by understanding what is normal for each series.
Use static thresholds when you have well-known, fixed limits (e.g., disk usage above 90%, error rate above 5%).
How It Works
- Historical analysis — The system looks at the last 30 days of data for each metric.
- Pattern detection — The system finds seasonal patterns, regular cycles, and normal changes using statistics.
- Adaptive boundary — Each metric gets its own alert threshold based on how it normally behaves. When a metric goes above or below this threshold, a critical alert is sent.
Thresholds are recalculated periodically so alert boundaries stay current as your system evolves.
Note: If a metric has less than 30 days of history, the system uses all the data it has to set an initial threshold. Thresholds get more accurate as more data becomes available.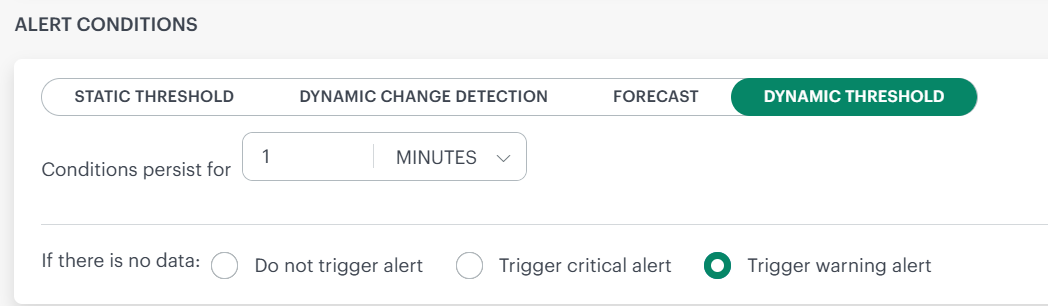
Configuration
Conditions Persist For To prevent alerts from firing on brief, transient spikes, you can require that a metric value must exceed its threshold continuously for a specified duration before an alert triggers.
- Conditions persist for: To avoid anomalous spikes, you can set a condition for an alert to trigger only if the metric value exceeds the thresholds persistently for some time.
| Setting | Details |
|---|---|
| Default | 1 minute |
| Range | 60 minutes |
Choose a longer persistence window for metrics that are naturally volatile (e.g., network throughput). Use a shorter window for metrics where any sustained deviation is critical (e.g., service health checks).
- If there is no data: If there is no data coming in, then you can choose one of the options:
- Do not trigger alert - No alert will be triggered, if no data comes in.
- Trigger critical alert - A critical alert will be triggered if no data comes in.
- Trigger warning alert - A warning alert will be triggered, if no data comes in.
Example
Consider the following query:
cpu_usage{group="Prod"}
This query may return hundreds or thousands of individual time series – one for each host, pod, container, or instance in the Prod group.
With dynamic thresholds, each series gets its own independently calculated boundary. When a series exceeds its boundary, a critical alert is triggered:
| Series | Dynamic Threshold | Alert Fires When |
|---|---|---|
cpu_usage{host="web-01"} | 72% | Value exceeds 72% |
cpu_usage{host="db-primary"} | 93% | Value exceeds 93% |
cpu_usage{host="cache-01"} | 35% | Value exceeds 35% |
A fixed threshold of 80% would miss the anomaly on cache-01 (35% is far below its normal) and constantly fire false alerts on db-primary (85% is normal for that host). Dynamic thresholds eliminate both problems.
Series Limitations
This limit exists to:
- Control computational overhead
- Protect the ML threshold calculation pipeline
- Avoid excessive memory and processing consumption
- Ensure predictable alert evaluation performance
If your query returns more than 2,000 series, narrow the scope by adding label selectors:
Too broad — may exceed 2,000 series
cpu_usage{group="Prod"}
Narrowed — filter by cluster or region
cpu_usage{group="Prod", cluster="us-east-1"}
Tip: Use the Explore view to check how many series your query returns before creating an alert definition.
Best Practices
| Practice | Why |
|---|---|
| Start with a 5-minute persistence window | Reduces noise while still catching real issues. |
| Review alert behavior after the first week | Confirm that thresholds align with your expectations. |
| Combine with static thresholds where appropriate | Use dynamic for behavioral patterns, static for hard limits. |
| Keep series count well below 2,000 per alert | Leaves headroom and improves evaluation performance. |
Frequently Asked Questions
Q: What happens if my metric’s behavior changes significantly?
The system continuously re-evaluates based on the most recent 30-day window. After a sustained change in behavior, the threshold adjusts automatically.
Q: Do dynamic thresholds work with recording rules and aggregated metrics?
Yes. Any valid PromQL query that returns numeric time series can use dynamic thresholds.
Q: What severity are dynamic threshold alerts?
Dynamic threshold alerts are always of critical severity. If you need warning-level alerts, use static thresholds with a lower value.
Q: What if I disagree with a calculated threshold?
You can review the historical data and threshold computation for any series in Metric Explorer. This helps you understand how the boundary was derived — including the seasonal patterns, trends, and variability the system detected. If the calculated threshold does not suit your requirements, switch to a static threshold for that specific alert definition. Dynamic and static thresholds can coexist across different alert definitions.
- Click SAVE. The alert definition is saved successfully.
You can enable or disable an alert definition, from the Alert Definitions listing screen.
Note: If you delete an alert definition, you must wait 1 hour before creating a new alert definition with the same name.
Alert limitation rule
Due to incorrect configuration of alert definition at the client level, multiple alerts might be generated. These alerts may impact the alert processing. Following are the rules set up to limit alert volume:
When the number of alerts generated for a specific alert definition exceeds 1,700 alerts within the last 1 hour, the system will:
- Trigger a Warning Alert.
- Send a notification to the user, alerting them about the high volume of alerts associated with a single alert definition.
When the number of alerts continues to increase and breaches 2,000 alerts within the last 1 hour, the system will:
- Trigger a Critical Alert to notify the user about the threshold breach.
- Automatically disable the alert definition to prevent further alert generation.
- Generate a Failure log with detailed information on the alert definition and associated metrics.
Note:
- The above rules are applicable for all alert conditions: Static Threshold, Dynamic Change Detection, and Forecast.
- The alerts (warning or critical) that are generated for the breach, have to be self-healed or suppressed.
Alert Definition limitation
The alert definition processes alerts from PromQL queries that return a maximum of 200,000 time series data points. If this limit is exceeded, no alerts will be generated.
To generate alerts, modify the query to include filters that narrow down the data, or configure alert definitions at the group, site, custom attributes, or service map levels.
This is applicable for all type of thresholds (Static, Change Detection, and Forecast).
Following table describes the columns in the METRIC-BASED ALERT DEFINITIONS listing screen.
| Column | Description |
|---|---|
| Name | Name of the alert definition. This is a clickable link that opens the alert definition details page. |
| Unique Id | A system-generated unique identifier for the alert definition. This ID is typically used for internal tracking, APIs, or integrations. A copy icon allows quick copying of the ID. |
| Entity Type | Displays whether the alert is defined at the Resource or Client level. |
| Alert Type | Indicates the category of the alert definition, such as Metric or Trace , based on the data source used to evaluate the alert. |
| Query | Shows the query used to evaluate and trigger the alert. |
| Enabled | Indicates whether the alert definition is currently active. A toggle shows the enabled or disabled state of the alert definition. |
Actions on an alert definition
Below are the actions you can perform on an alert definition.
| Action | Description |
|---|---|
| Search | To search for an alert definition:
|
| Filter | Filter alert definitions based on Entity Type and Status:
| View and Edit | To view an alert definition:
To edit an alert definition:
View Failure Logs | To view failure logs: | Copy | To create a copy: | Remove | To remove an alert definition: | |