The Activity UI provides a comprehensive view of system activities and operations in OpsRamp. This page describes the key components of the Activity interface, including how to view, filter, and search activity logs. Understanding these features helps you monitor system changes, track actions, and troubleshoot issues more effectively.
Activity listing page
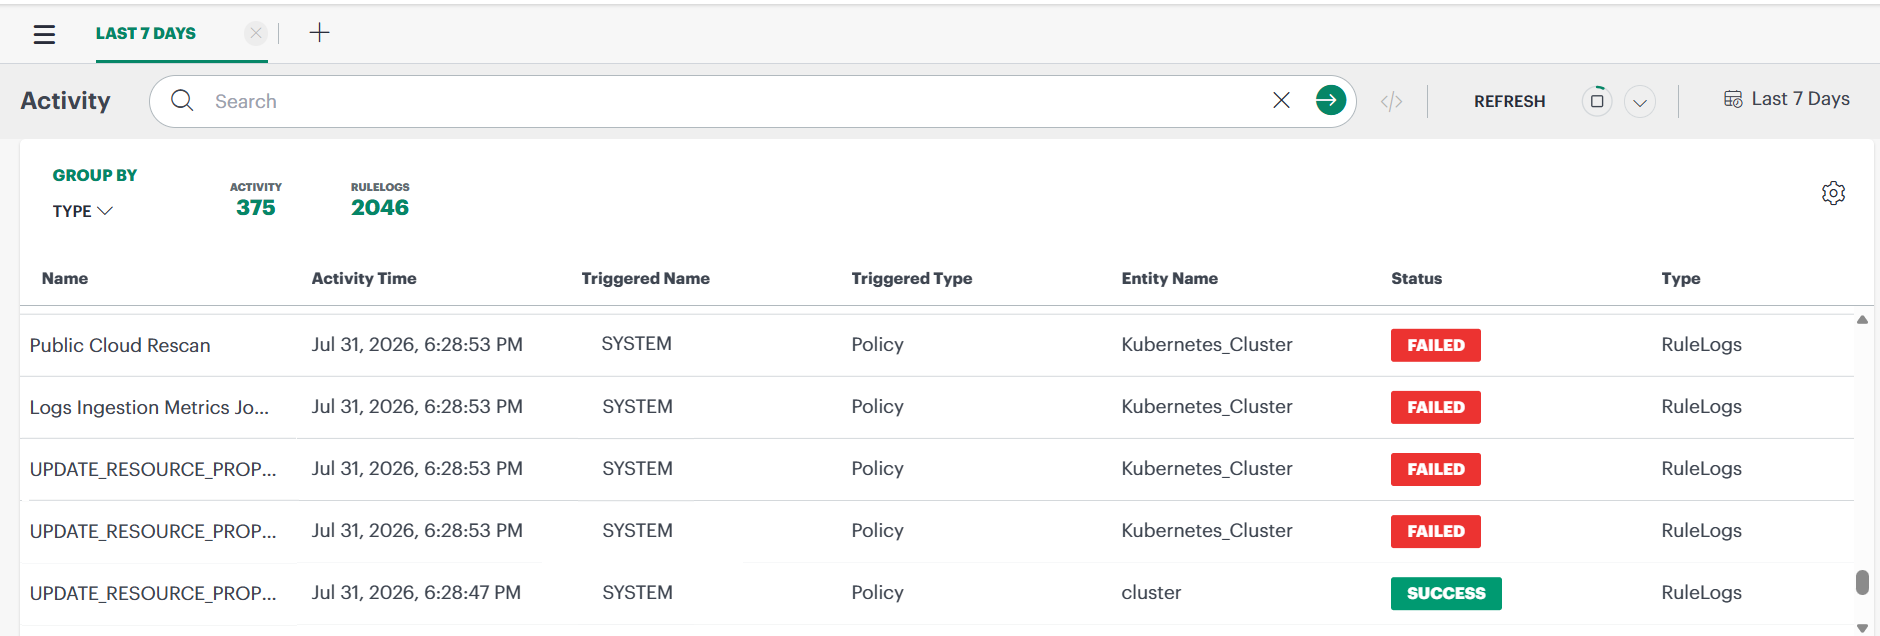
The main Activity listing page displays activities in a table format with the following default columns:
| Column | Description |
|---|---|
| Name | The name or identifier of the activity. |
| Activity Time | The timestamp (date and time) when the activity occurred. |
| Triggered Name | The name or identifier of what triggered the activity. Examples include specific policy names, rule names, or System when triggered by automated system processes rather than a named policy or rule. |
| Triggered Type | The type of trigger (e.g., Policy, Bulk Operation). |
| Entity Name | The target resource, client, or entity affected by the activity. |
| Status | The outcome of the activity (Success, Failed, In Progress, Queued, Complete). |
| Type | The category of activity (e.g., RuleLog, BulkLog). |
Filters and Controls
The Activity UI provides filters and controls to help you search, organize, and customize your activity view. These tools let you refine results and display only the information you need.
| Element | Description |
|---|---|
| Group By | Organize activities by using Type and Status grouping options: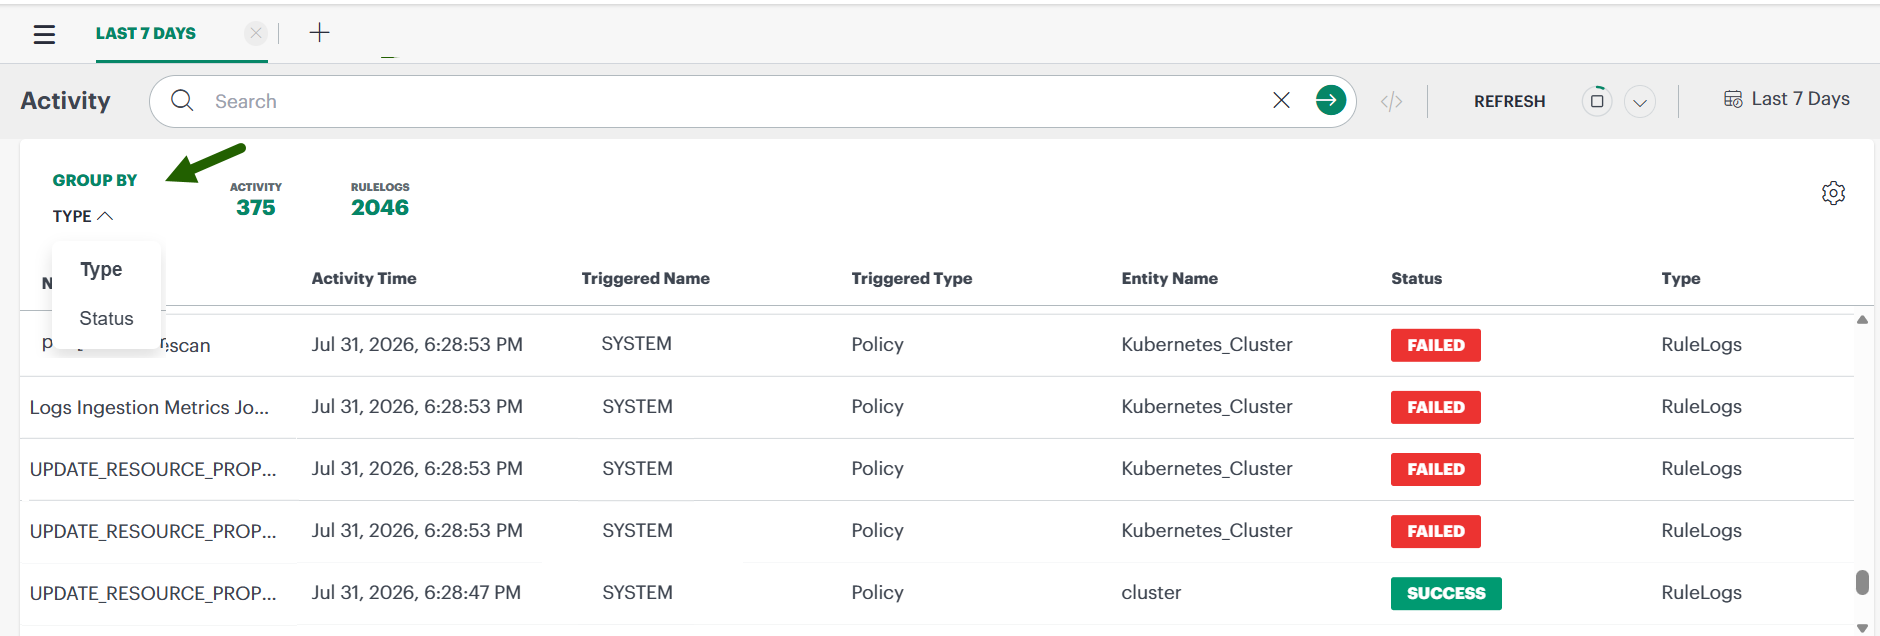
|
| Column Settings | Customize the visible columns in the activity list table.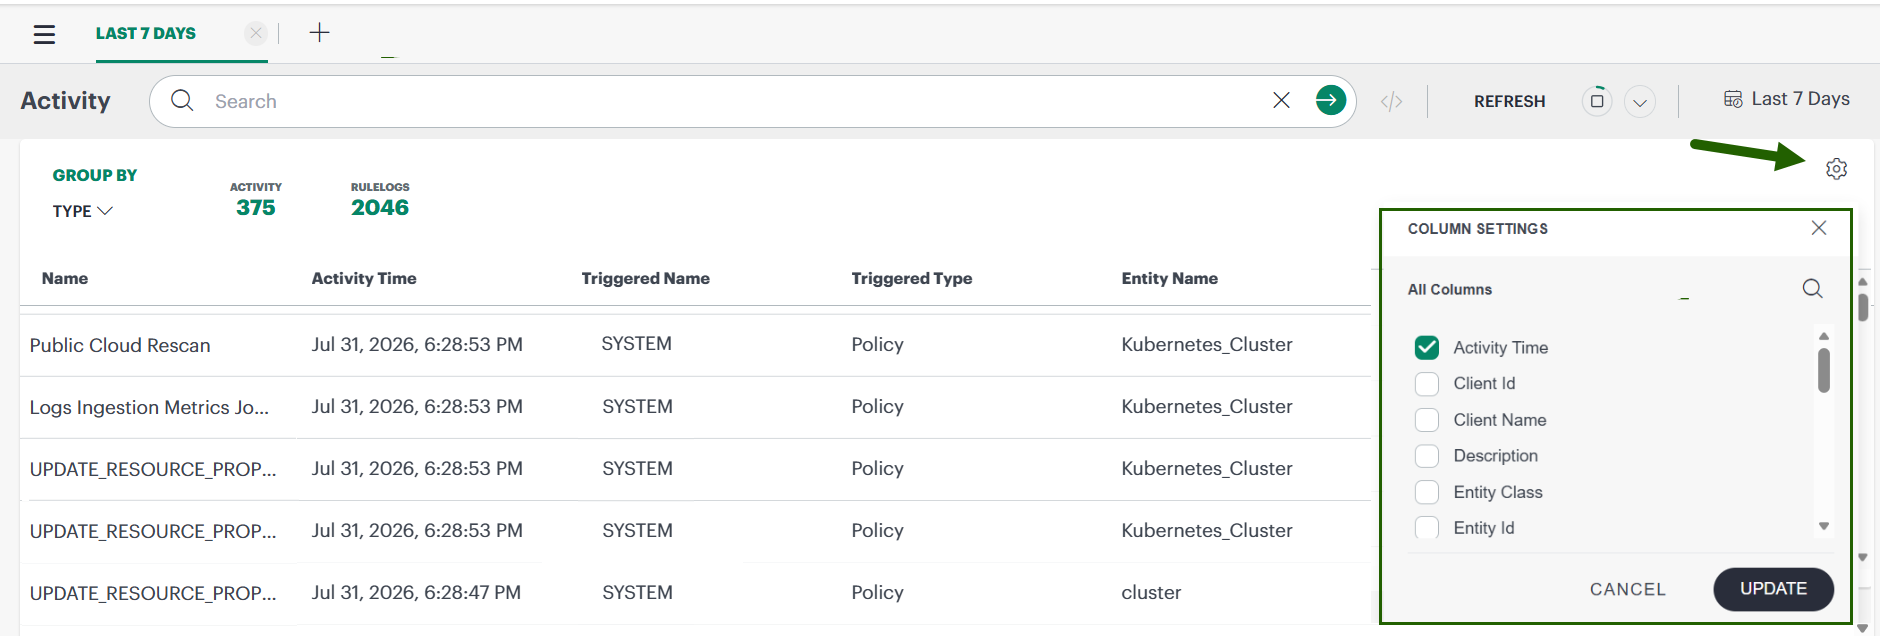 Select or clear columns to display only the information relevant to your needs, including Name, Activity Time, Triggered Name, Triggered Type, Entity Name, Status, and Type. |
| Date Range Picker | Select custom time windows or predefined options: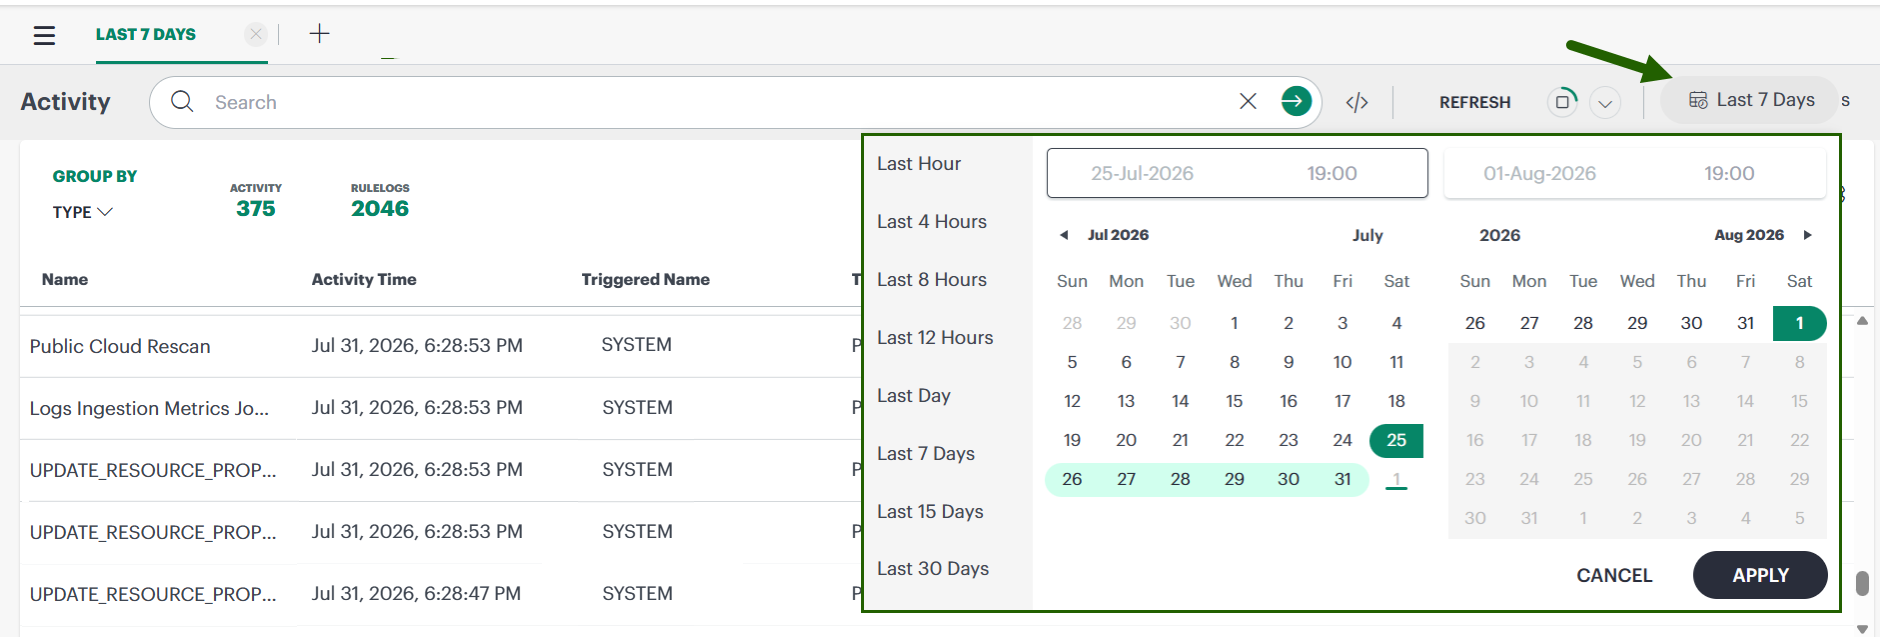
|
| Search | Build queries by using attributes such as status, triggered name, or entity name in the OpsQL search box.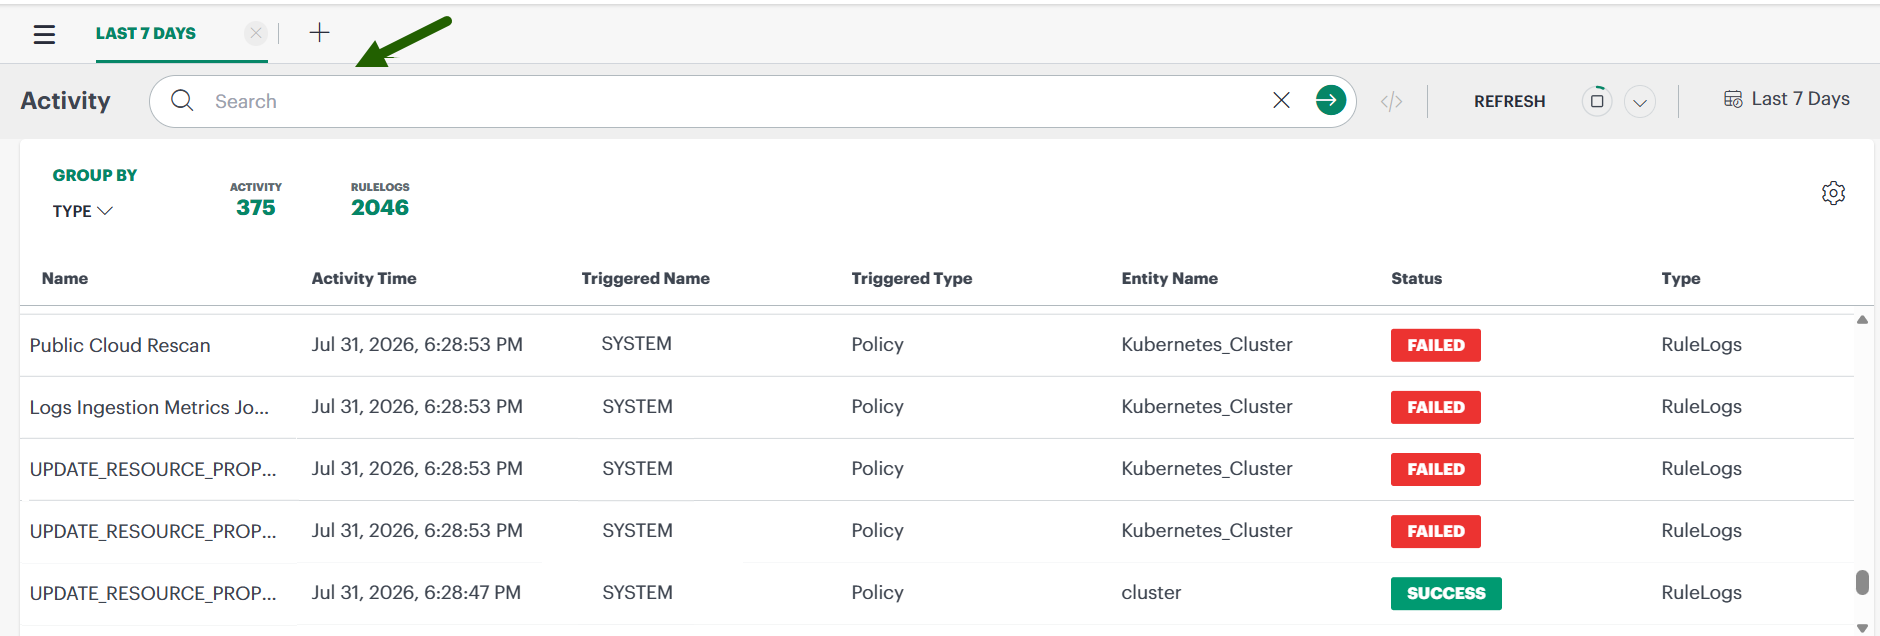 |
Activity details slide-out
When you select an activity from the listing page, a slide-out appears on the right side of the page.
This slide-out provides an in-depth view of the selected activity. Use this information to understand what action was performed, who or what triggered it, and the operation outcome.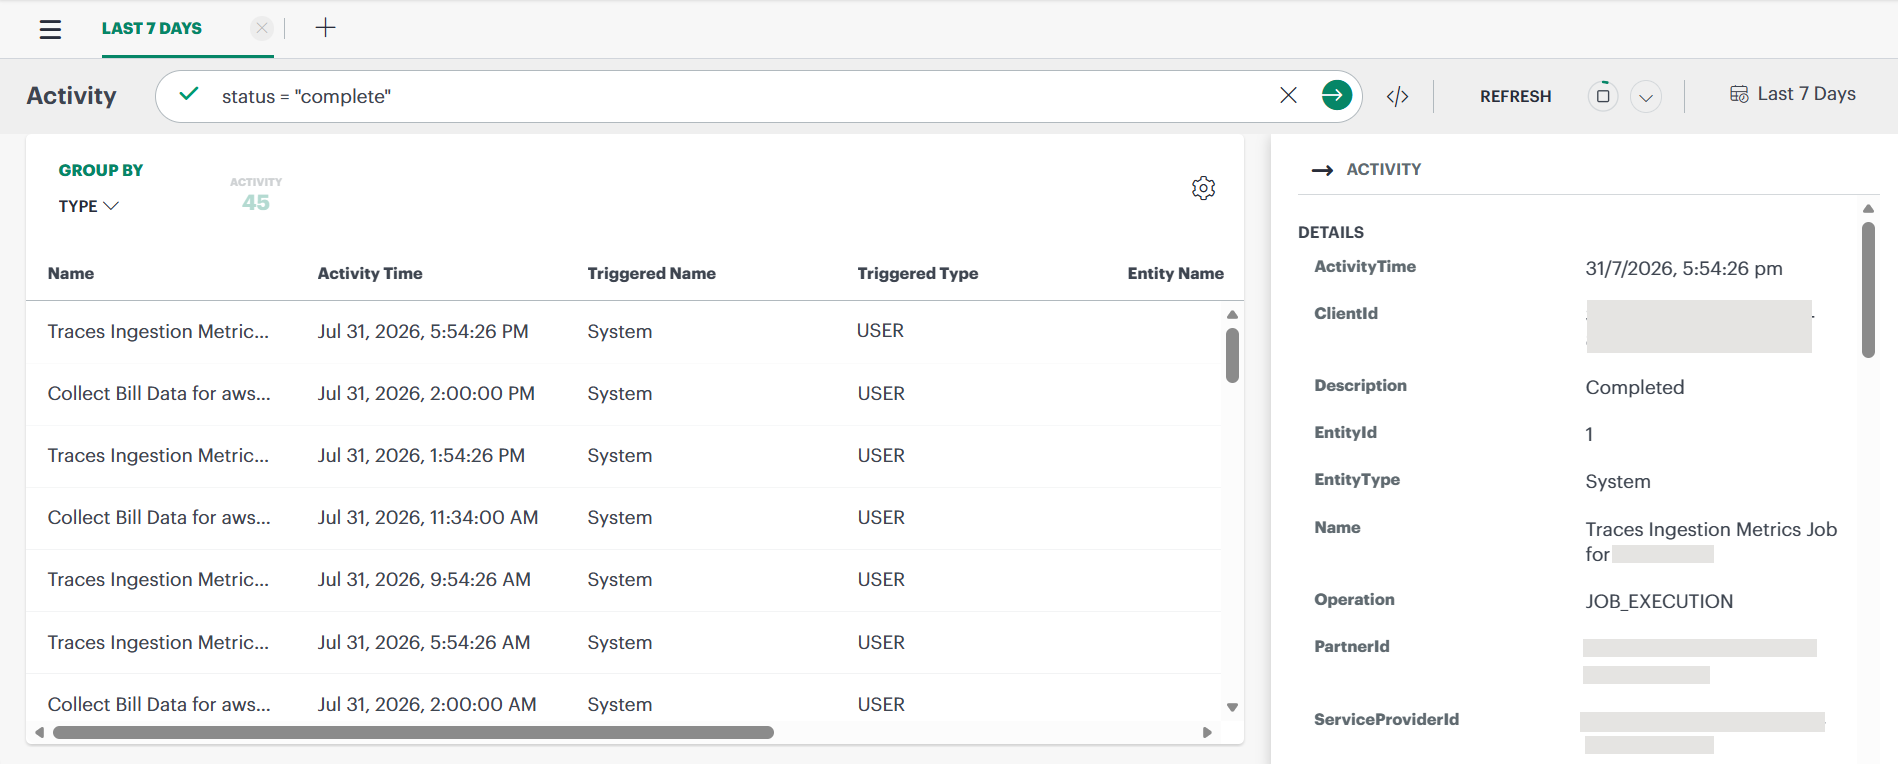
The slide-out displays the following comprehensive information:
| Column | Description |
|---|---|
| Activity Time | Full timestamp (date and time) of the activity. |
| Client ID | Unique identifier for the client account. |
| Description | Detailed error or status message. |
| Entity ID | Internal identifier of the affected resource. |
| Entity Type | Classification of the resource (e.g., RESOURCE, POLICY). |
| Name | Activity name or operation type. |
| Operation | The specific operation performed (for example, UPDATE_RESOURCE_PROPERTIES, JOB_EXECUTION, and related operations). |
| Partner ID | Associated partner or organization identifier. |
| Service Provider ID | The associated service provider unique identifier. |
| Status | Current status (Success, Failed, Queued, or In Progress). |
| Triggered Type | The trigger type (for example, User, Policy, or Bulk Operation). |
| Triggered ID | Identifier of the triggering event or activity. |
| Service Provider Name | The name of the service provider that executed the activity. |
| Partner Name | The associated partner or organization name. |
| Client Name | The name of the client account. |
| Triggered Name | The name or identifier of what triggered the activity (e.g., policy name, rule name, or System). |
| Target | The target resource or entity affected by the activity. |
| Percent Complete | The progress percentage for activities in progress or queued. |
| Tenant ID | Unique identifier for the account associated with the activity. |
My Activity Views
The My Activity Views slide-out lets you save and manage custom activity searches for quick access.
To open the slide-out, click the hamburger icon in the upper-left corner of the page.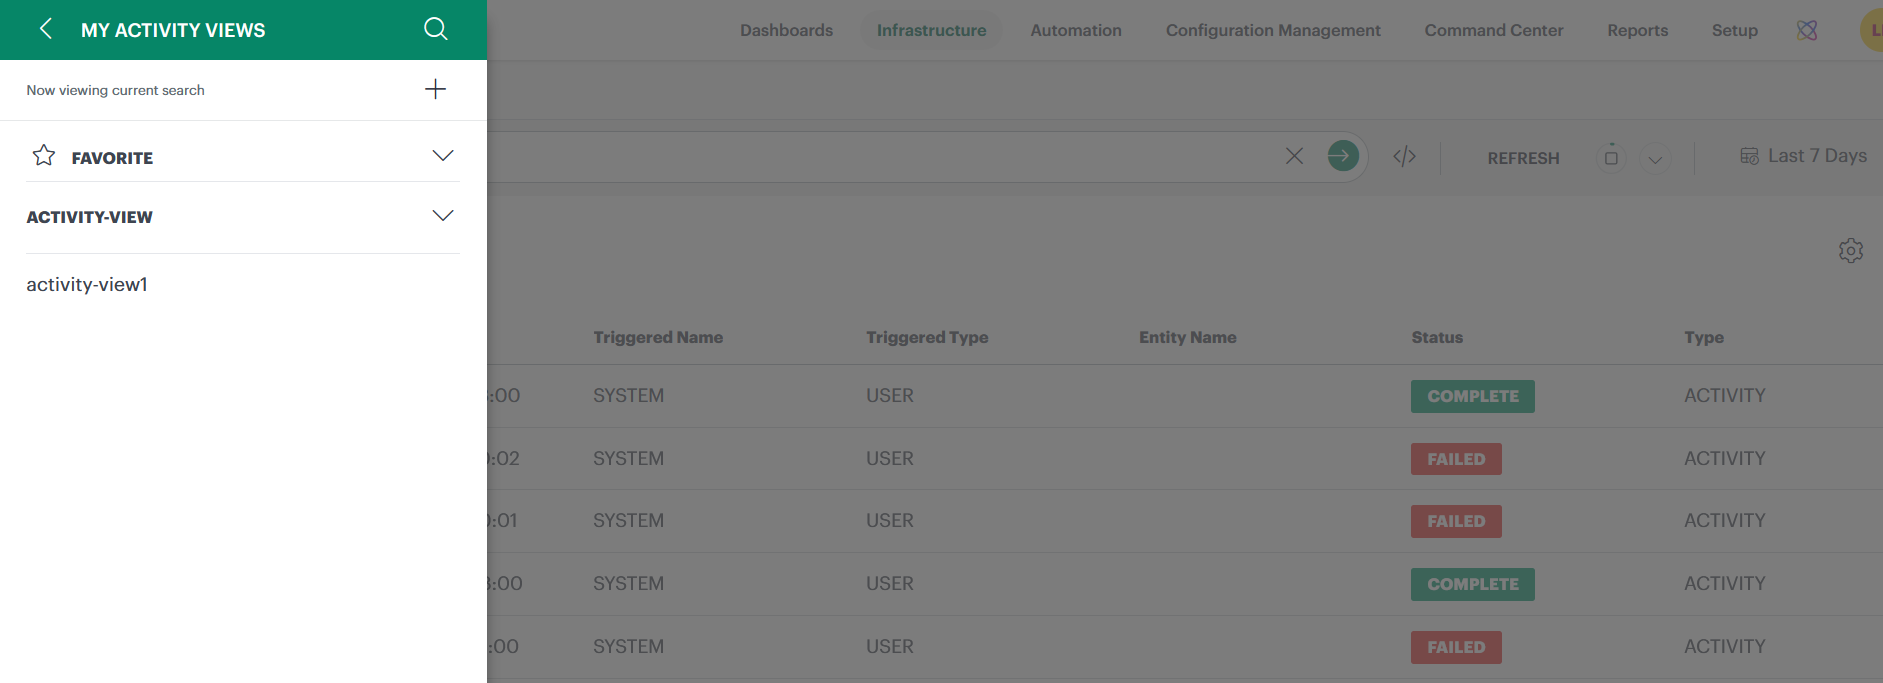
See My Resources Views for more information.
See Activity for Activity query examples.