What is Application Monitor?
Application monitoring templates are utilized to monitor device performance and statistics using predefined configurations. These templates enable the monitoring of various application performance metrics and statistics, providing insights into the health and functioning of applications running on monitored devices. By applying these templates, users can effectively track key performance indicators, identify potential issues, and ensure optimal performance of their applications.
This is an old way of developing custom monitors using a legacy agent-based monitoring engine framework. It explains custom monitor scripts and monitor creation in the legacy G1 framework, see Agent G1 - Custom Monitor - PowerShell - How To?
Note
It is not recommended to develop any new custom monitors using this legacy framework, as it will be deprecated soon.Supported application types
- Active Directory (AD)
- IIS
- MSSQL
- MySQL
- SharePoint
- MS Lync
- Exchange
- Citrix XenApp
- Citrix XenDesktop
- Hyper-V
- OS-level monitoring metrics
How to develop a G1 template
You can develop the G1 template using a VB.NET console application or PowerShell. Once the required script is developed, it needs to be updated in the database, and the version associated with its .exe or .ps1 file must be added.
Note
We do not recommend using the G1 framework, so a detailed explanation is not provided here. Use the G2 framework to monitor the required metrics instead.How to create a G2 template out of a G1 application
Step 1: Create the monitor
- Go to the Setup page.
- Navigate to Monitoring.
- Click Monitors.
- Select Agent as the Adapter Type.
- Select Using G1 Monitor as the Monitor Type.
- Select the required G1 application at Application.
- Cross-check whether the configuration parameters are correct, if any parameters are available in the G1 application.
- Click Save to save the monitor.
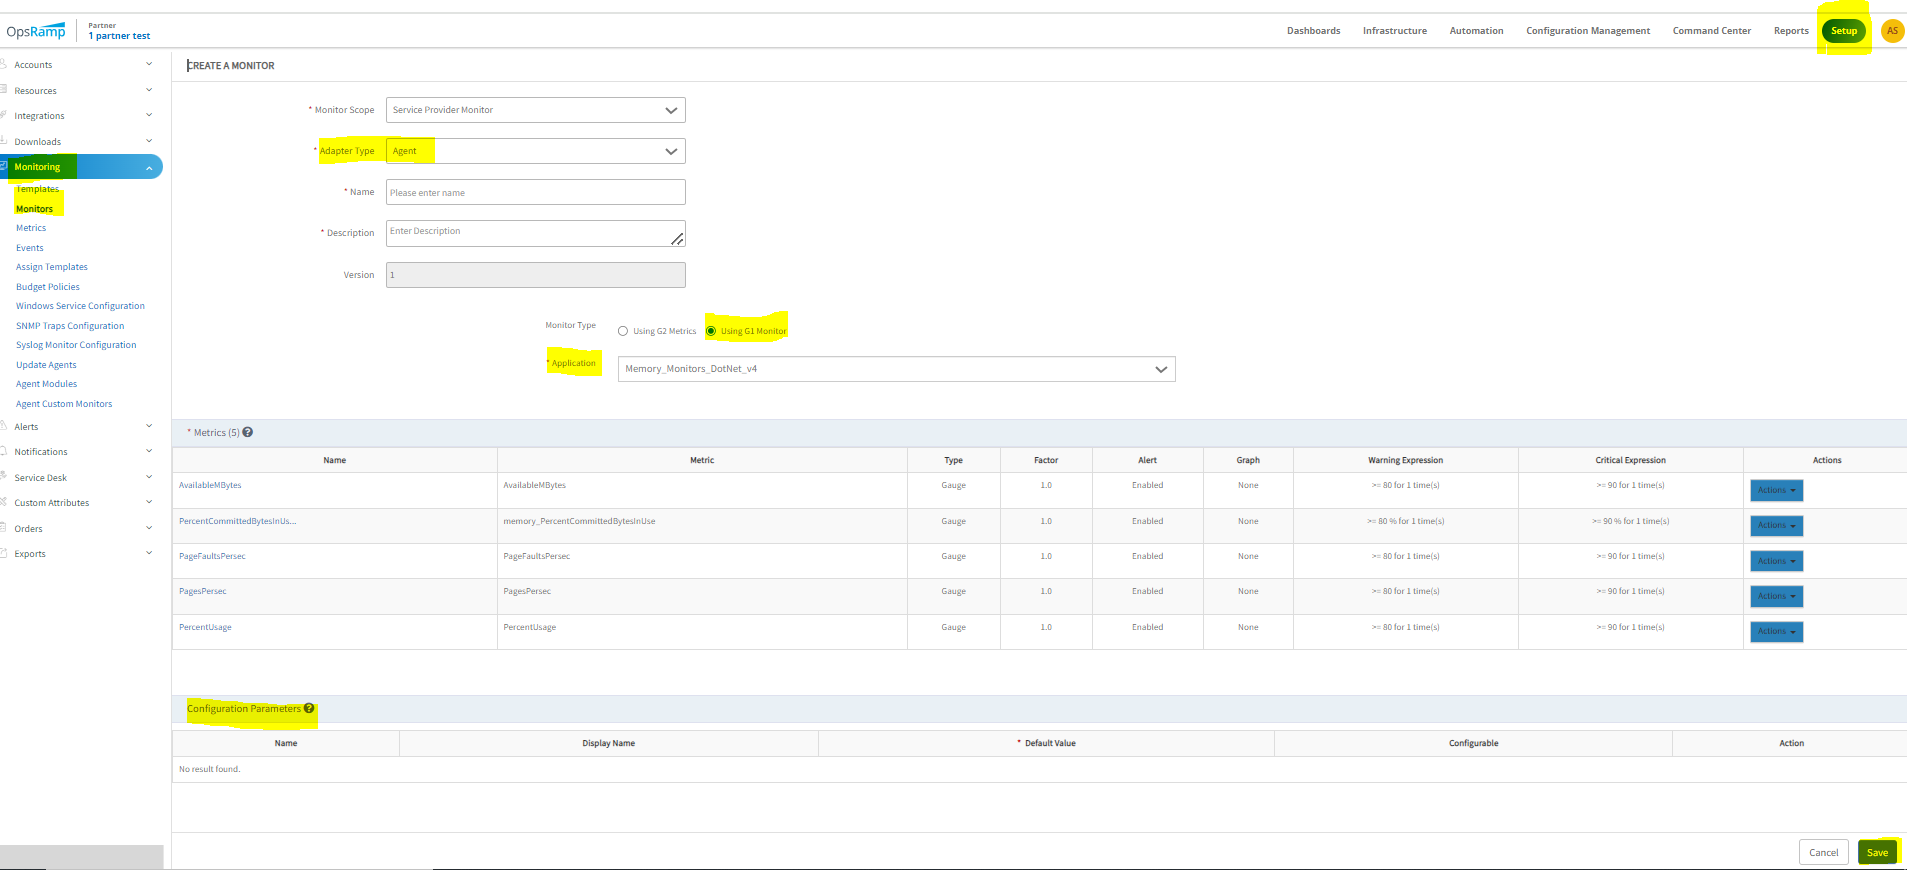
Step 2: Create a template from the monitor
Create a template from the G1 monitor created in step 1, similar to a G2 template:
- Go to the Setup page.
- Navigate to Monitoring.
- Click Templates.
- Select Agent as the Collector Type.
- Select G2 Monitors as the Monitor Type.
- Select Device as Applicable For.
- Provide the required Template Name, Description, and other necessary details.
- Click Add in Monitors, select the required Frequency and Monitor Definition Name, then click Add again.
- Click Save.
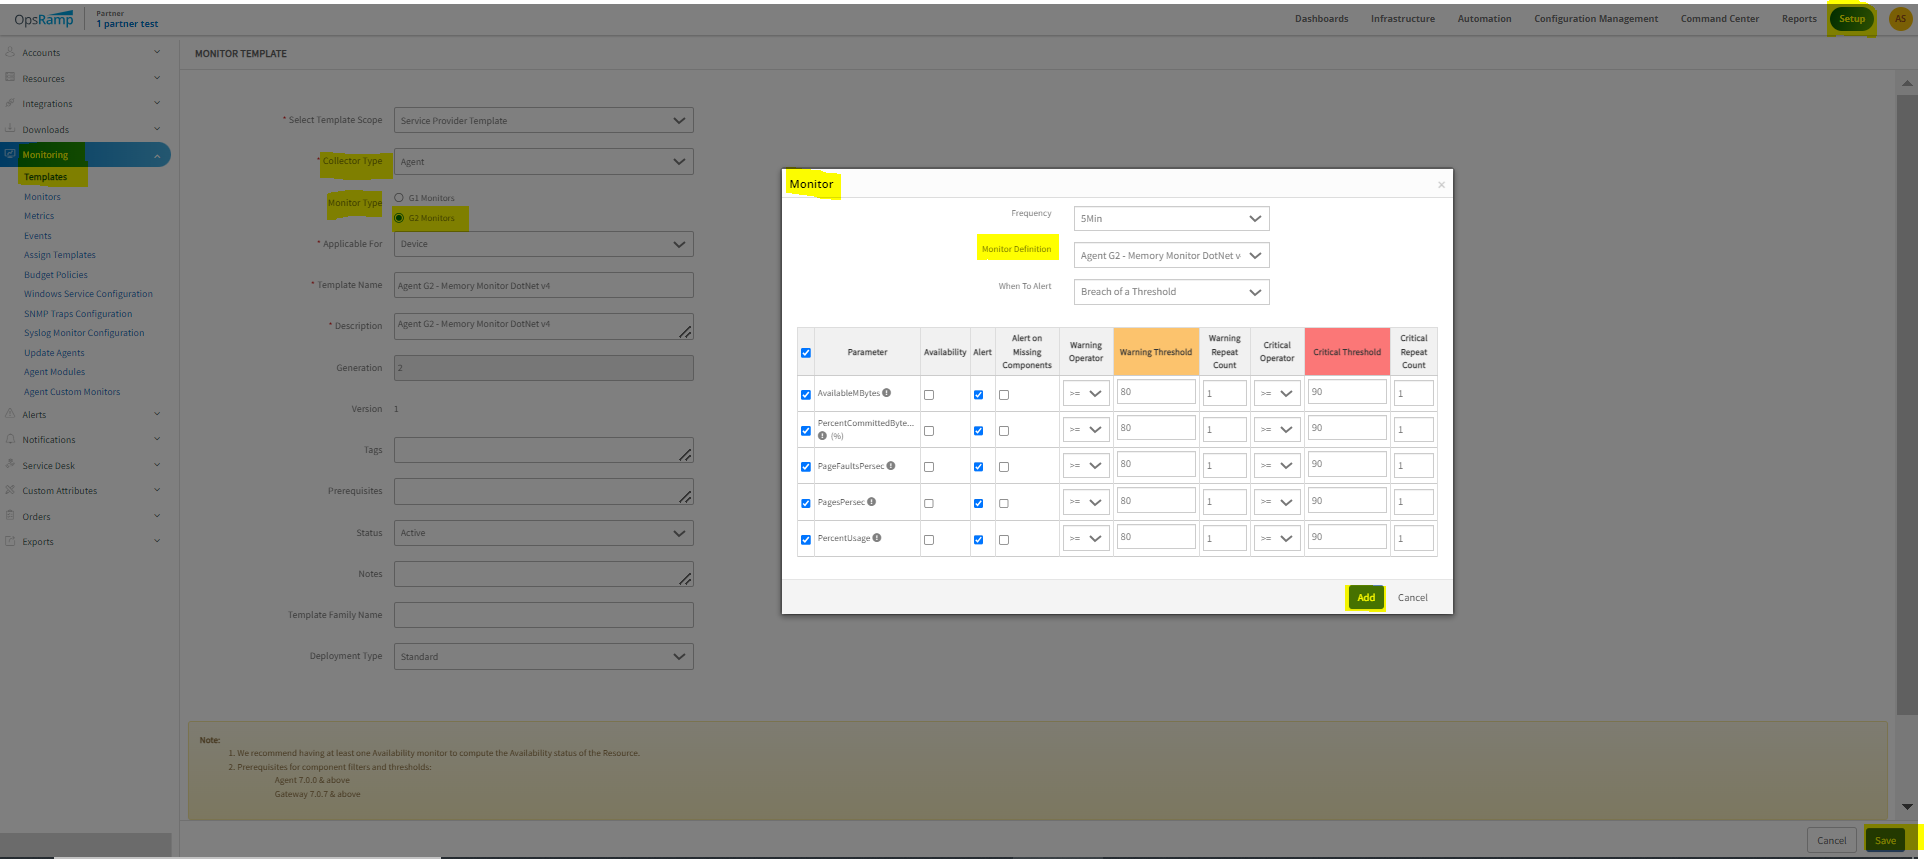
Validate WMI classes using WBEMTest
Open WBEMTest:
- Press Win + R to open the Run dialog.
- Type
wbemtestand press Enter.
Connect to the WMI namespace:
- In the WBEMTest window, click Connect.
- In the Namespace field, enter
root\cimv2(the default namespace for most WMI classes). - Click Connect.
Query WMI classes:
- Click Query in the WBEMTest window.
- In the Query window, type your WMI query. For example, to query the
Win32_Processorclass to get the number of CPU cores, type:
SELECT * FROM Win32_Processor- Click Apply.
View query results:
- If the query is valid, a list of instances returned by the query is displayed.
- Double-click any instance to see its properties and values.
Validate specific properties:
- Within the instance window, scroll to find the property you are interested in, for example,
NumberOfCoresforWin32_Processor. - Check the value to ensure it is what you expect.
- Within the instance window, scroll to find the property you are interested in, for example,
Example: Validate CPU core count
- Open WBEMTest: Press Win + R, type
wbemtest, and press Enter. - Connect to the namespace:
- Click Connect.
- In the Namespace field, enter
root\cimv2, then click Connect.
- Run the query:
- Click Query.
- In the Query field, type
SELECT * FROM Win32_Processor, then click Apply.
- View the results:
- A list of processor instances is displayed.
- Double-click an instance, then scroll through the properties to find
NumberOfCores. - Verify that the value matches the expected number of CPU cores.
Additional tips
- Use class info: To get more details about a specific class, click Enum Classes, select the required class, and click OK.
- Error handling: If the query does not return any results, or if there is an error, make sure the WMI service is running and that you have the appropriate permissions.
- WMI documentation: For more information on WMI classes and their properties, see the Microsoft WMI documentation.
Using WBEMTest is a powerful way to explore and validate WMI classes, ensuring your scripts and queries are correct before deploying them in production environments.
Validate WMI classes using PowerShell console
To validate the WMI class Win32_Processor using the PowerShell console, use the Get-WmiObject or Get-CimInstance cmdlet.
Using Get-WmiObject:
Get-WmiObject -Query "SELECT * FROM Win32_Processor"
Using Get-CimInstance (recommended for newer versions of PowerShell):
Get-CimInstance -Query "SELECT * FROM Win32_Processor"
Both commands retrieve and display information about the processors on your system.
Detailed example
Using Get-WmiObject:
- Open PowerShell.
- Run the following command:
Get-WmiObject -Query "SELECT * FROM Win32_Processor" | Format-List
Using Get-CimInstance:
- Open PowerShell.
- Run the following command:
Get-CimInstance -Query "SELECT * FROM Win32_Processor" | Format-List
Explanation:
Get-WmiObjectandGet-CimInstanceboth query the WMI classWin32_Processor.- The
| Format-Listpart of the command formats the output as a list, making it easier to read.
This outputs detailed information about the processors, including properties such as the name, number of cores, clock speed, and more.
Troubleshooting
Use case 1: Monitoring data is not being collected for DotNetv4 templates
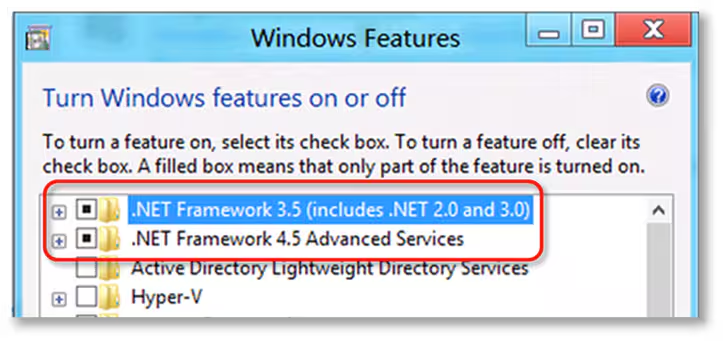
The first and most fundamental step to ensure you receive monitoring data from DotNetv4 templates (G1, or G2 partially migrated from G1 to G2) is to validate that the end device has the .NET Framework 3.5 Features installed, that is, .NET Framework 3.5 (includes .NET 2.0 and 3.0).
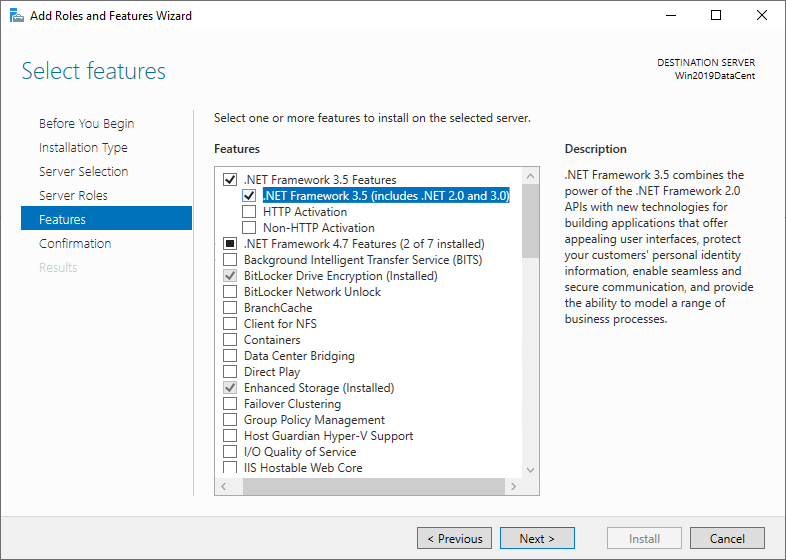
Use case 2: Unable to fetch the latest snapshot data
When a user applies an Agent-based G1 template on a Windows device and encounters the message “Failed to get latest snapshot/Agent is offline/No Data Available” while fetching the latest metrics data, follow the steps below:
- Navigate to the Overview section of the device (Infrastructure > Resources > search using IP or device name), and on that device, ensure that the Agent is installed and online (indicated by blue color).
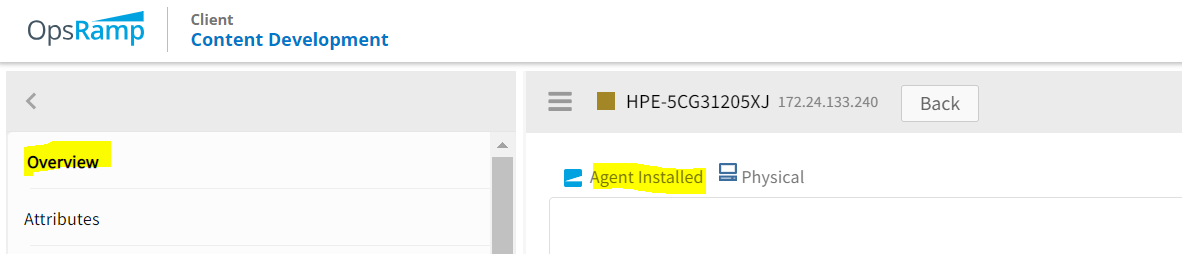
- Identify whether the template is global or customer-written. To determine this, see G1 FAQs question 1.
- Gather debug-level logs and manually run the script to obtain the script output. See Retrieving debug logs and Executing G1 scripts manually.
Use case 3: How to verify whether the associated plugin or file (.exe/.ps1) has been downloaded to the target folder
- Custom Monitors (G1) are stored in this default path:
C:\Program Files (x86)\OpsRamp\Agent\utils - Application Monitors (G1) are stored in this default path:
C:\Program Files (x86)\OpsRamp\Agent\plugins
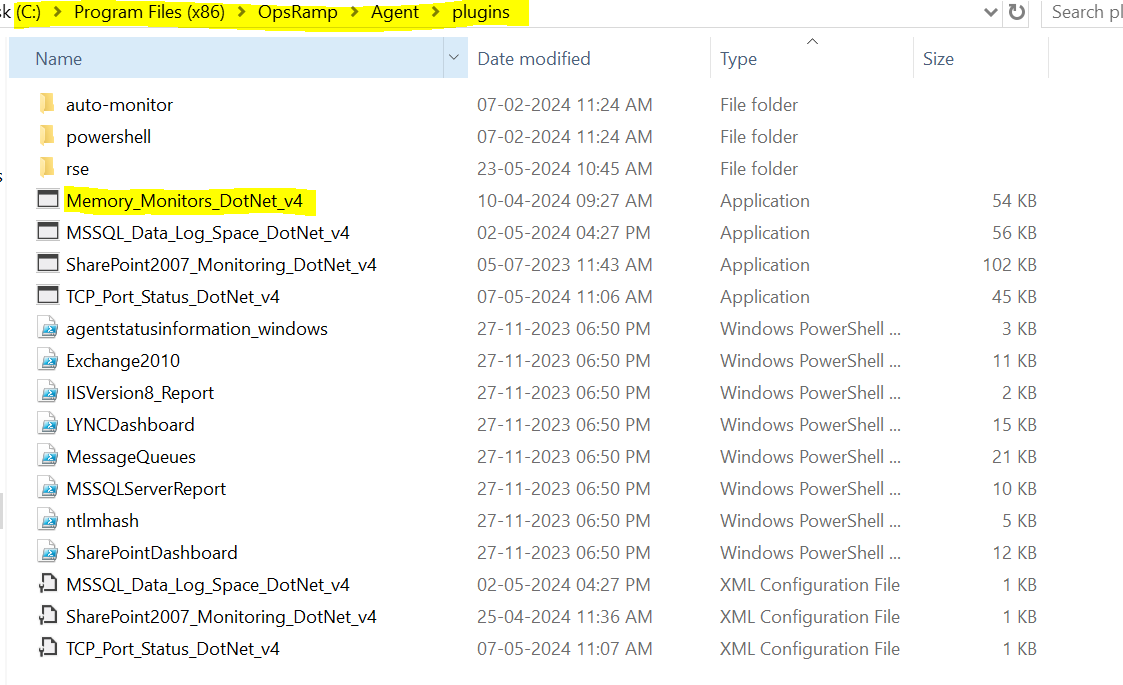
Use case 4: How to validate that the version has been recorded in the database for the plugin/file
If the required plugin is available in the specified path and you are still not receiving monitoring data, verify whether the plugin version has been inserted into the database. You can do this using the query results provided by the SAAS team for the reported POD.
-- Database: msp_report
select script_name, version from monitor_scripts where script_name = 'Memory_Monitors_DotNet_v4.exe';
Use case 5: Graph data is not populating for specific metrics or all metrics
Things to check:
- Validate whether the metric is retrieving data from the end device by checking the latest snapshot data. If it is not, see Use case 1.
- Verify whether the graph is enabled at the metric level. If it is enabled, check whether the data is available from the latest snapshot data.
- Look for the line
GBUF(MetricName)in the log. If the metric name is not present againstGBUF, the metric is not posting graph data. In this case, consult the Agent team to determine why the graph data is not being posted. - Check for any “Invalid class” or “Invalid Query” entries in the log against the device. For example:
12-11-2021 15:26:43 [debug] [pid 3812] [tid 3120] [W] [xmlfunc:2399] Subject: MSSQL_2012_Advanced_Monitoring: MSSQL Active Transactions: Critical: Invalid class
Use case 6: How to check for any “Invalid Class” or “Invalid Queries” in the log data
Use case 7: Gaps in the metric graphs
This issue might be due to one of the following reasons:
- The Agent going offline at that time.
- The device itself being offline.
- No data was available for the metric on the device at that time.
Check the debug-level logs to verify whether the Agent or device was offline at that time. If you do not find any related logs, raise a case and attach logs to analyze the command/script behavior at the specific times when the graph is not populating.
Use case 8: Alerts are not being generated for a specific metric on the resource
- Check the latest snapshot data to see if data is being retrieved from the device for that metric.
- Verify the thresholds defined for the metric.
- If the latest snapshot data is also not coming for that metric, execute the command or script manually on the device to see if any data exists for that metric.
- Raise a case with your findings if the issue is still unclear.
Use case 9: Alerts generated do not align with the defined alert thresholds
- Enable debug-level logs. See Retrieving debug logs.
- Verify the thresholds given in the UI against those synced on the device.
- If the UI and device thresholds are not the same, it indicates a sync issue. In case of improper sync, check the Agent version and update it to the latest version.
- If the UI and device thresholds are synced correctly, check whether the newly generated alerts also have the same issue.
- Raise a case with your findings if the issue still persists.
Retrieving debug logs
Step 1: By default, the Agent log level is set to warn. To enable debug-level logs, perform the following steps on the end device:
- Navigate to
C:\Program Files (x86)\OpsRamp\Agent\conf. - Open the
configuration.propertiesfile. - Under the
[Log]section, locate thelog_levelparameter. - Change the value of
log_levelfromwarntodebug. - Save the changes to the
configuration.propertiesfile.
Step 2: You can also change the log level to debug from the UI.
Executing G1 scripts manually
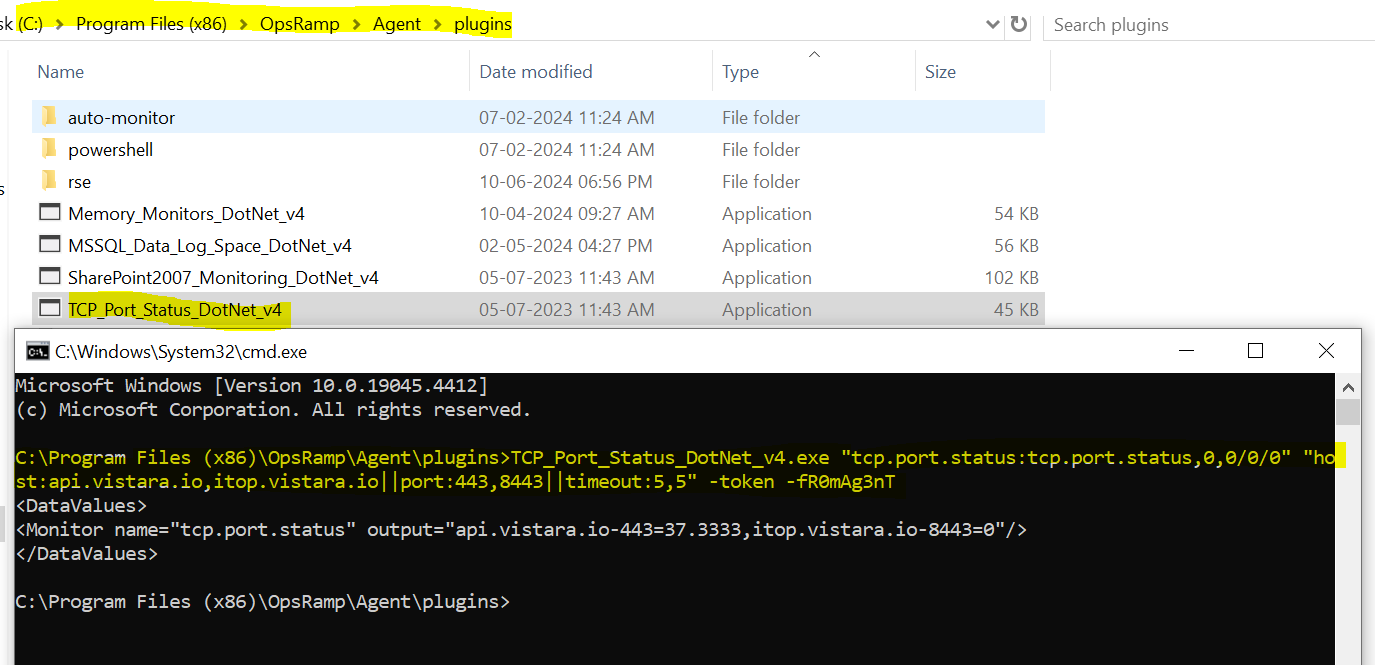
Open the command prompt in the location where the plugin file (.exe or .ps1) exists and invoke the file, providing custom parameters if required. You should then see the plugin file output between the <Datavalues> and </Datavalues> tags.
Below is an example screenshot of the script execution with arguments:
FAQs
1. How to identify whether a Metric, Monitor, or Template is global or customer-specific?
The details available in the links below pertain to global templates and metrics. Any template, monitor, or metric scoped to a Service Provider, Partner, or Client is not considered global.
- Global template details
- Metric details (metric details have been partially migrated from the Agent G1 framework to the G2 framework)
2. How to troubleshoot an Agent G1 template issue with basic steps?
- Check whether the Agent is online or offline.
- Check whether any alerts, such as “Invalid class” or “Invalid query,” exist for that metric.
- Check whether the required plugin file has been downloaded to the
C:\Program Files (x86)\OpsRamp\Agent\pluginsfolder. - Check the
Agent\log\appmon.txtfile for script output details.
3. How to enable debug-level logs for Agent G1 templates?
4. Where are the G1 script files (.exe or .ps1) located?
- Custom Monitors are stored in this default path:
C:\Program Files (x86)\OpsRamp\Agent\utils - Application Monitors (G1) are stored in this default path:
C:\Program Files (x86)\OpsRamp\Agent\plugins
5. How to check the output of G1 templates?
- Agent G1 Application Monitors:
C:\Program Files (x86)\OpsRamp\Agent\log\appmon.txt - Agent G1 Application Monitors (partially migrated from G1 to G2):
C:\Program Files (x86)\OpsRamp\Agent\log\appmong2.txt
6. How to execute G1 templates manually?
See Executing G1 scripts manually.
7. What types of errors are mostly seen in Agent logs for G1 templates due to threads hanging?
Getting WMI data Failed, Error Num:262148Received Application mon request, but thread index - 1 already running...DAGExchangeLocalHost_Improved.ps1 is Already Running
These types of errors occur in older Agent versions. If any of these appear in the Agent logs, ask the user to upgrade the Agent to the latest version and validate the monitoring data.
8. Alerts and snapshot data are working, but the graph is not updating. Why?
Check whether the line GBUF:Perf (MetricName) is present in the log. If the metric name is not available against GBUF, the metric is not posting graph data. In this case, check with the Agent team to determine why the graph data is not posting.
9. Why does the log show “.exe/.ps1 not found while executing, sending request to server for downloading the app mon file”?
This occurs because the version is not inserted in the database, so the executable cannot download to the target location. Either:
- The database does not have the file and the version updated, or
- The database has the file, but the version is not inserted.
10. What if “Invalid class” is found in the log data?
Validate the WMI classes used in the template:
Log error for reference: Application mon invalid instance: [UserConnections]: Invalid class
11. How does the latest snapshot data work for an Agent G1 Monitor (for status/state-related metrics)?
For status/state-related metrics in G1, do not consider the state obtained in the latest snapshot data. For metrics related to status/state defined in the code itself, the state is defined based on the metric value.
12. If monitoring data is not updating, has the correct template been assigned to the end devices?
If the end device has the AD application installed, but the MSSQL template is assigned, monitoring data for the MSSQL template is not collected. For an AD server, assign only the AD template, considering the version if available.
13. How to identify whether the Agent is sending graph data?
If the metric name appears after GBUF:Perf (for example, GBUF:Perf (AvailableMBytes)), the Agent is sending graph data.
Example: 29-12-2016 06:13:02,809 [INFO] GBUF:Perf (AvailableMBytes).
14. What if incorrect alerts are being generated?
Check whether any changes made to the metric thresholds have been synced to the end device. Also check the OpsRamp\Agent\log\prevstate folder to verify that it has the correct state of the alert.
15. How to validate continuous “Ok” alerts?
Check whether the threshold configurations have been synced to the end devices in the log folder. The issue might persist on the template side or with the device configurations pushed. After validating the logs, a fix can be provided.
16. Ensure the correct input arguments are used in the correct format
For example, when monitoring IIS App Pool State, provide the IIS App Pool names separated by commas (,), exactly as they appear on the device, following case sensitivity. If these guidelines are not followed, the input provided is not valid.
17. What causes a “Just-in-Time Debug” error message?
This occurs due to a lack of permission to create or update the prevstate file.
18. How to create a G2 template out of a G1 application?
See How to create a G2 template out of a G1 application.
19. How to identify that the .NET 4.5 feature is not enabled on the end device?
If .NET Framework 4.5 is not enabled, an error is displayed for Windows Application templates.
20. How to validate whether incorrect alerts are generating from a partially migrated G2 template?
If continuous “Ok” alerts are generated, collect the logs and validate the thresholds synced to the device. Also check the prevstate data file located at OpsRamp\Agent\log\prevstate\.
21. How to identify that a template is partially migrated from G1 to G2?
- The metrics associated with the template are not visible under the Monitoring Metrics section on the Setup page.
- The monitor assigned to the template has an Adapter Type of Agent.
- The script content is not visible in the UI framework.
22. How are the states generated in the G1 latest snapshot?
When reviewing the latest snapshot of G1 templates, the states are generated based on the configured thresholds for those metrics.
23. Is exception handling available for G1 application monitoring templates?
No, complete end-to-end exception handling is not available for G1 application monitoring templates. However, there is support for handling specific exceptions, such as “Out of Memory” and “Exception while querying WMI class.”
24. How to create a Metric, Monitor, and Template in G1?
Metrics and Monitors cannot be created for G1 from the UI, and this will be deprecated soon. Use the existing partially migrated templates or the G2 templates instead.
25. Which queries or commands are used for the template?
There is no direct option to view the classes or commands used in G1 templates, because they are built using the .NET Framework, resulting in .exe files. The source code for these files is maintained by the OpsRamp team.
26. In partially migrated templates, does the script/Agent handle the alerts and graph data?
The Agent processes the metric names and values, then populates the graph and alert data accordingly.
27. How can a user personalize the alert subject and description?
Create a copy of the global monitor, see Copy Monitor, then:
- To modify the alert subject of a metric, use the Edit option in the Actions tab at the monitor on the Setup page for the relevant metric.
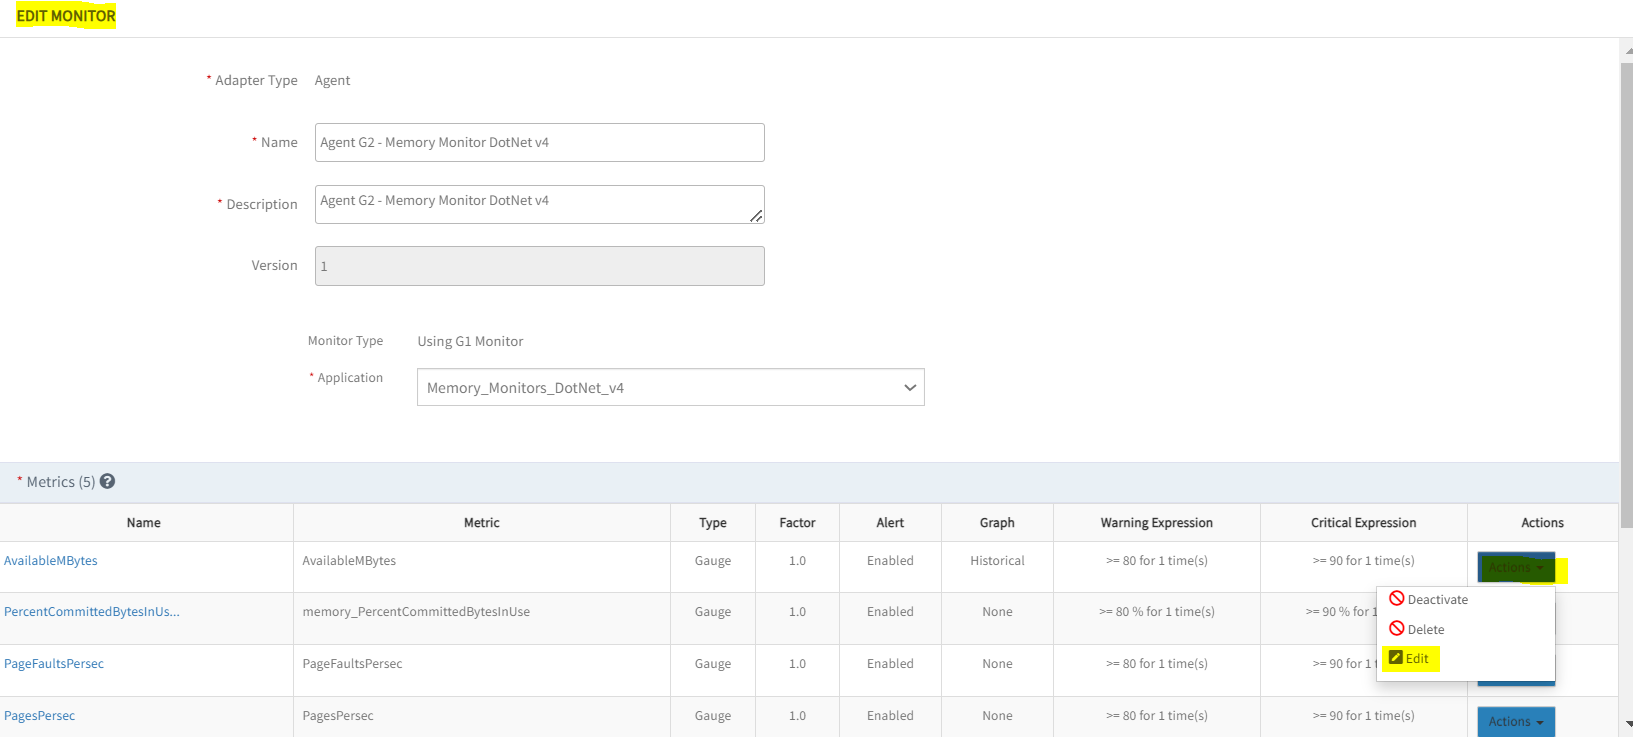
- After clicking Edit, enter a custom message in the Subject field for the alert subject and the Description field for the alert description.
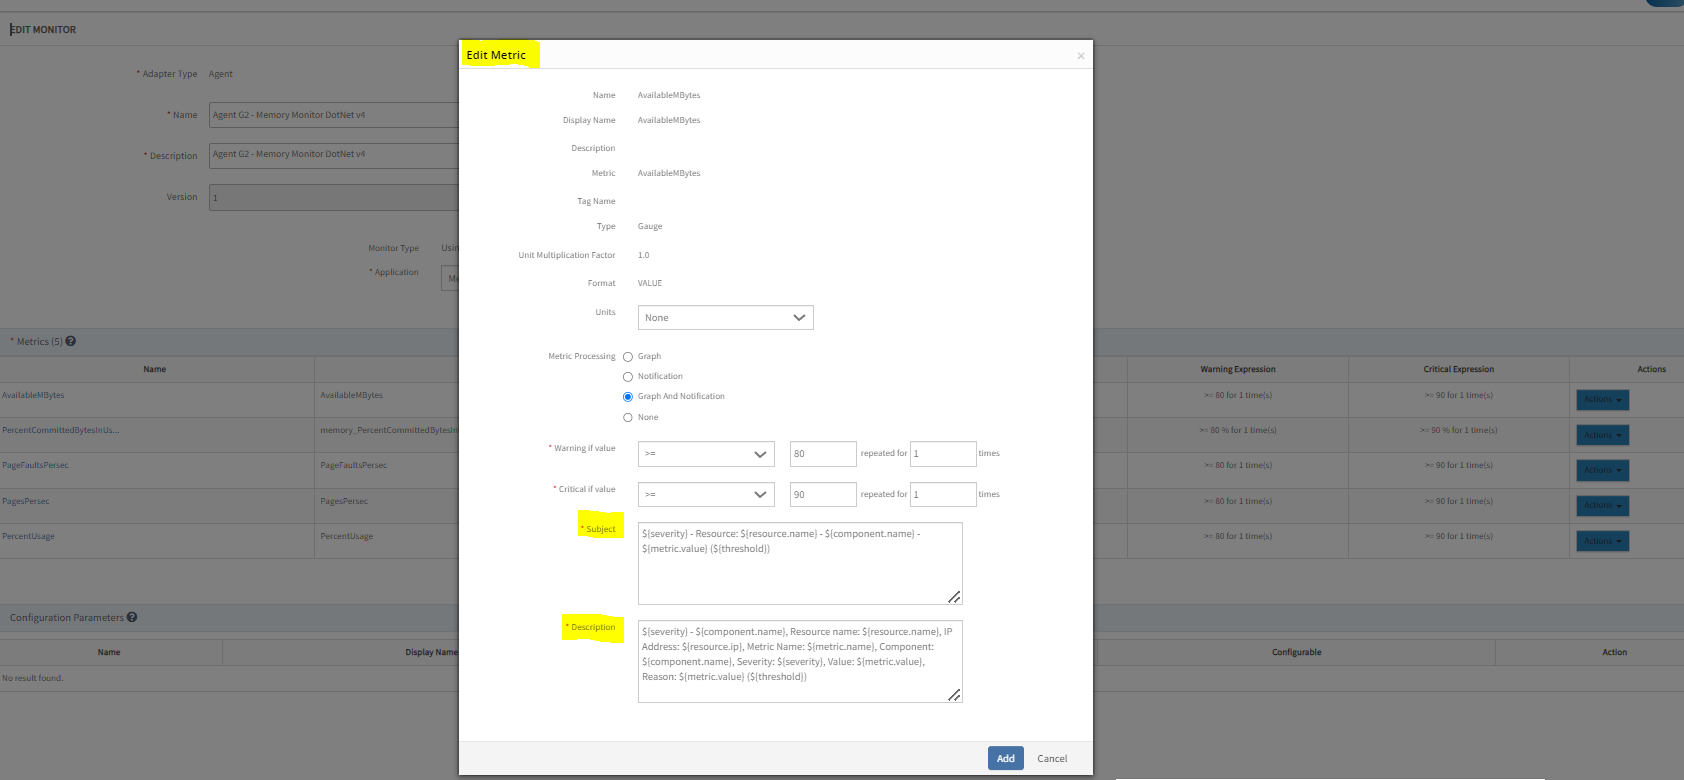
- After making these adjustments, re-add the monitor to the template for the changes to take effect.
28. Does G1 support repeat count functionality?
No, repeat count functionality is not supported by either the Collector or the script.