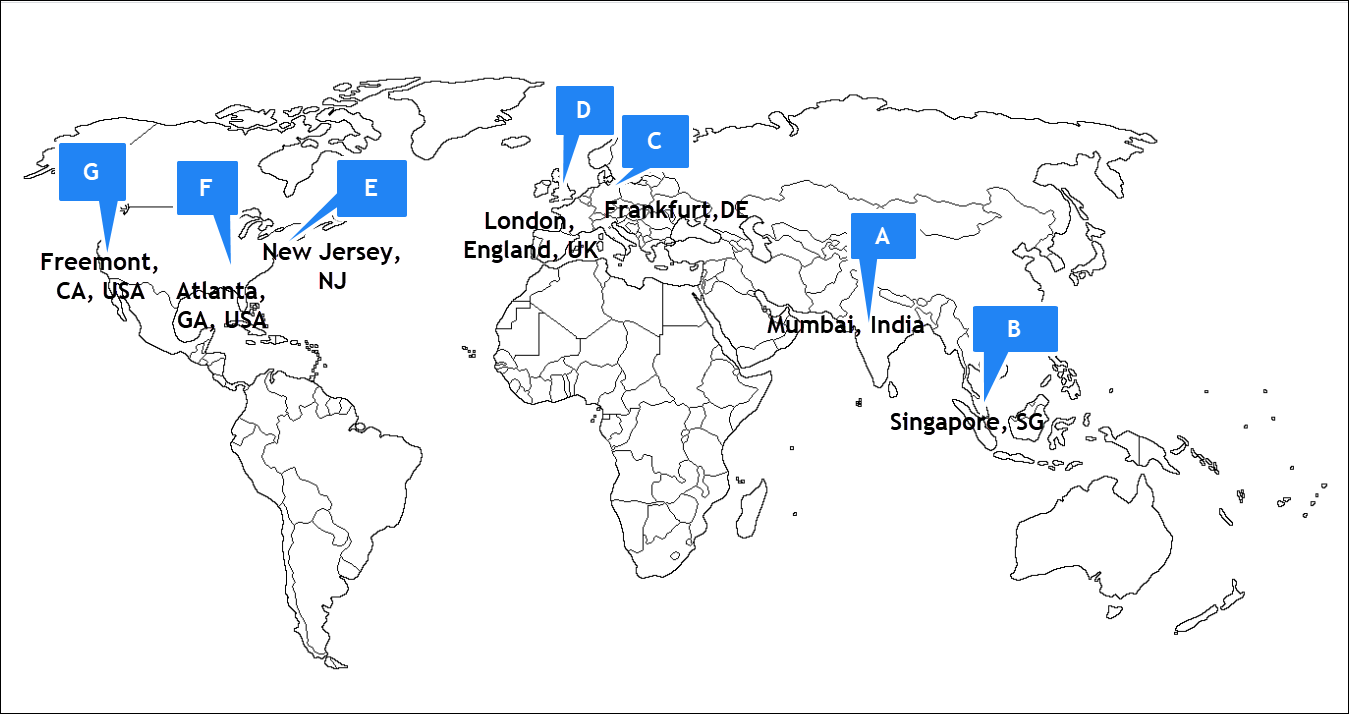
Websites and internet services can be monitored from different geographical locations - both public and private.
Scenario
You want to verify that web applications are up and running and detect any fluctuation in the network traffic.
How can you get the right levels of visibility to understand the key points to improve the user experience and better application performance?
Solution: Use synthetic monitoring for the 24*7 monitoring of its services across all locations and getting regular updates. Using the SCRIPT – HTTP Synthetic Transaction Monitor, you can create simulations of the possible paths or actions that customers can do on their website. The SCRIPT-HTTP synthetic monitoring technique monitors each path or action at configured intervals to understand the actual user experience and sends alerts for any issue before that could impact the customers.
Using Synthetic monitoring, you can monitor internet services from public and private locations. Depending on the requirements, you can choose one of the following monitoring environments:
- Monitoring only from public locations.
- Monitoring only from private locations.
- Monitoring from private and public locations.
Public and Private Locations
If the environment includes web applications in both private and public locations, do the following to start monitoring:
Step 1: Whitelist the IP address (public)
- Whitelisting IP addresses is an important factor to enable access to the added monitors from each location.
- Refer to the Whitelisted IP addresses of public synthetic servers.
Step 2: Implement a instrumentation strategy (private)
- To monitor any synthetic resources, install the gateway (version 5.0.0 or above).
Step 3: Onboard resources and users (public and private)
- Onboarding involves the setup needed to discover and manage your environment.
- Before using the platform, the main requirement is to create an account to do the tasks for your organization.
- For more information, see Account Management.
Step 4: Enable resource management profiles (private)
- Use gateway version 5.0.0 or above to enable internet and intranet monitoring of the infrastructure, after enabling the Synthetics Agent.
- Toggle from
OFFtoONto enable Synthetics Agent from Setup > Resources > Management Profiles > View Management Profile. - Once the synthetic Agent/Collector is enabled in the management profile view page, a new template called “OpsRamp Synthetic Service Status” will be automatically assigned to the gateway devices that are linked with the gateway profile.
To view this template, navigate to Infrastructure > Resource > Gateway, followed by Resource > Monitors. From there, you will be able to see the assigned template in the Template tab.Note
The “OpsRamp Synthetic Service Status” template will be available from version 15.0.0 gateway release.
Step 5: Set up synthetic monitors (public and private)
- Assign a synthetic template to initiate synthetic monitoring using Assign Templates or Device Management Policies.
- Set permissions for Device Create, Device Edit, Device View, and Device Manage to create, edit, view, and delete the configured synthetic monitors respectively.
- Verify if the role assigned to you has access to all resources. Otherwise, you cannot delete a synthetic monitor.
Configuring synthetic monitors according to the requirement enhances synthetic security and stabilizes IT operations process flow. For more information, see Creating synthetic monitors.
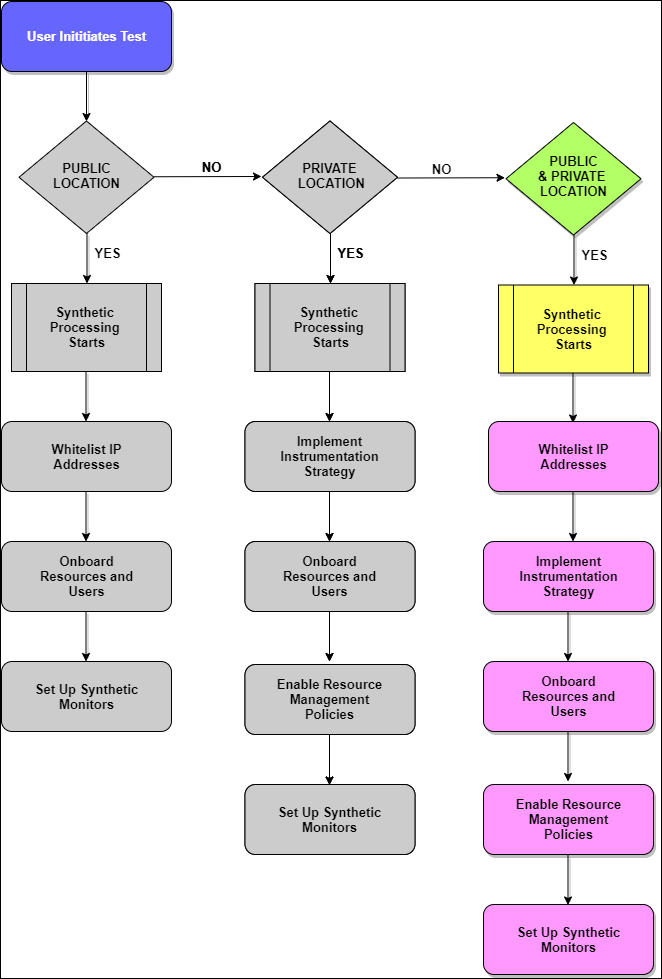
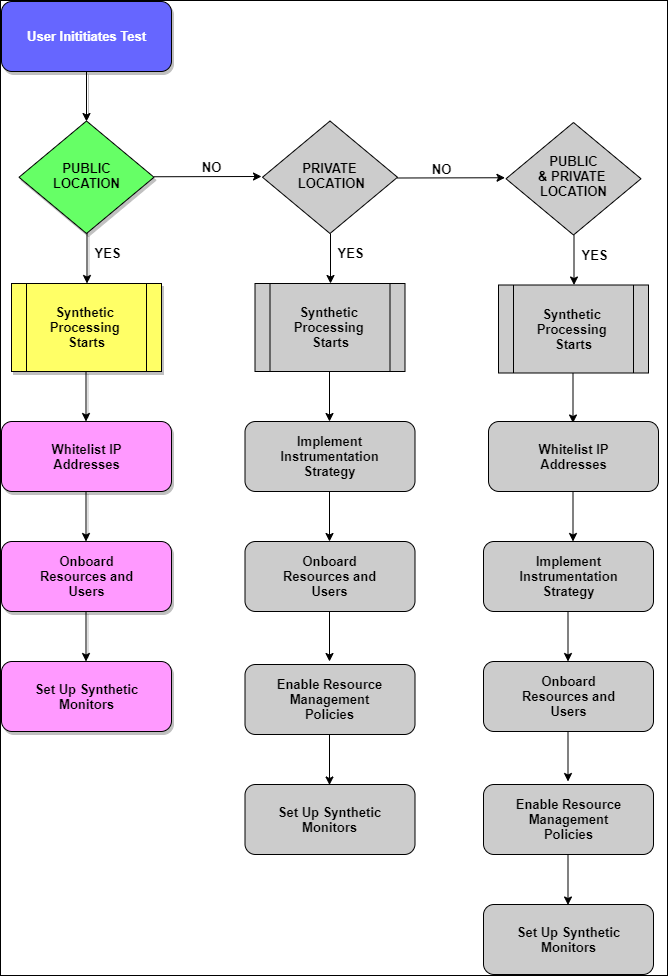
Public Locations Only
Synthetics support monitoring is available from multiple locations (Asia, Europe, or North America) across the globe. Managing monitors from different locations infers receiving performance and availability information of the applications and internet services.
To set up your environment for monitoring from a public location:
- Step 1: Whitelist your IP addresses
- Step 2: Onboard resources and users
- Step 3: Set up the synthetic monitors
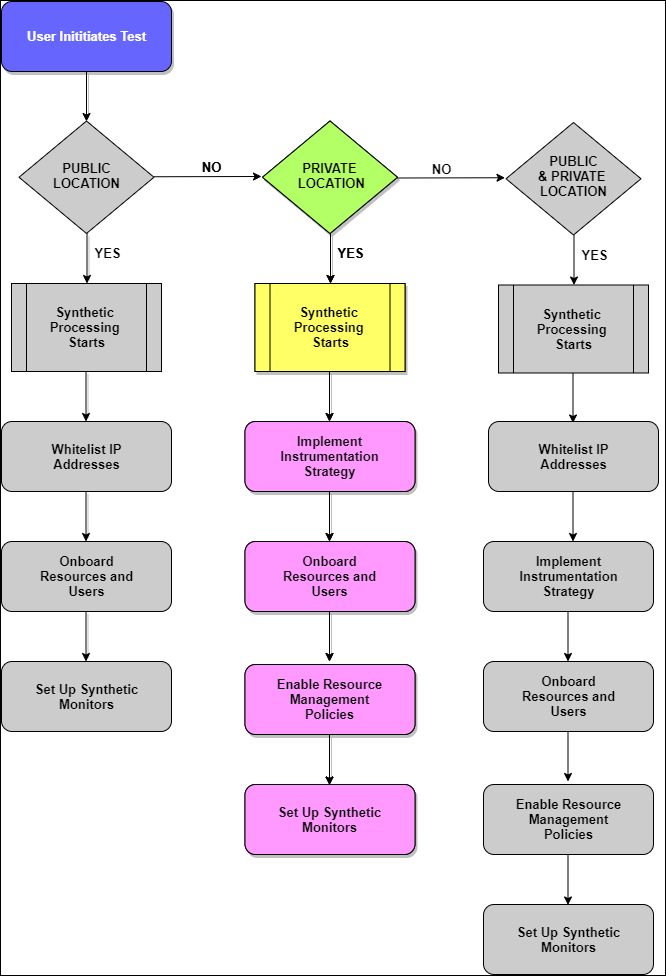
Private Locations Only
Enabling synthetic monitoring from private locations using gateway helps administrators/SREs to track the availability and performance of the internal monitors using the internal network. Administrators can use the same test capabilities to track the availability of the monitors from a public location.
- Step 1: Implement your instrumentation strategy
- Step 2: Onboard resources and users
- Step 3: Enable resource management profiles
- Step 4: Set up the synthetic monitors
Configuring Proxy Settings for Gateway Collector and OpsRamp Cloud
If there are any proxy in Gateway Collector and OpsRamp Cloud, follow the below steps to configure the proxy:
- Navigate to the directory
/opt/opsramp/webprobe/conf/. - Open the file
config.cfg. - Locate the proxy section.
- Enter the required details for the proxy server and proxy port according to your configuration.
- Save the changes.
- Restart the Synthetic Service using the command:
systemctl restart webprobe.