OpsRamp automatically assigns agent-based monitoring templates to supported gateway resources to help you monitor gateway capacity and performance. These templates collect key operating system and network utilization metrics that provide visibility into gateway health and resource consumption.
Supported Gateway Deployments
This enhancement applies to the following gateway deployments:
- ONGVMAU22 – NextGen Gateway ISO/OVA image
- ONGVMAU26 – NextGen Gateway ISO/OVA image
Note: NextGen Gateway deployments installed directly on Kubernetes clusters by using Helm charts are not supported.
Template Assignment
The following templates are assigned to supported gateways:
These templates are assigned in addition to the existing OpsRamp Gateway vProbe Performance template. The templates collect metrics only. Alerting is not enabled by default.
New gateways
For supported gateways deployed after the Platform 07 release, the monitoring templates are assigned automatically when:
- The gateway resource is registered.
- The OpsRamp Agent is installed and active on the gateway.
- If the required monitoring templates have been cloned and assigned, OpsRamp does not overwrite the cloned templates.
Existing gateways
For gateways that existed before the Platform 07 release:
- The templates must be assigned manually.
- If the gateway reconnects to OpsRamp and the required conditions are met, the templates can be assigned automatically.
- If the required monitoring templates have been cloned and assigned, OpsRamp does not overwrite the cloned templates.
- For information about assigning monitoring templates, see Assign monitoring templates to resources page.
View Gateway Performance Metrics
- Navigate to Setup > Account > Collector Profiles.
- Click the Gateway resource name for the collector profile you wish to view the resource details. The resource details page is displayed. Or, go to Infrastructure > Resources and select the gateway resource.
- Click the Metrics tab.
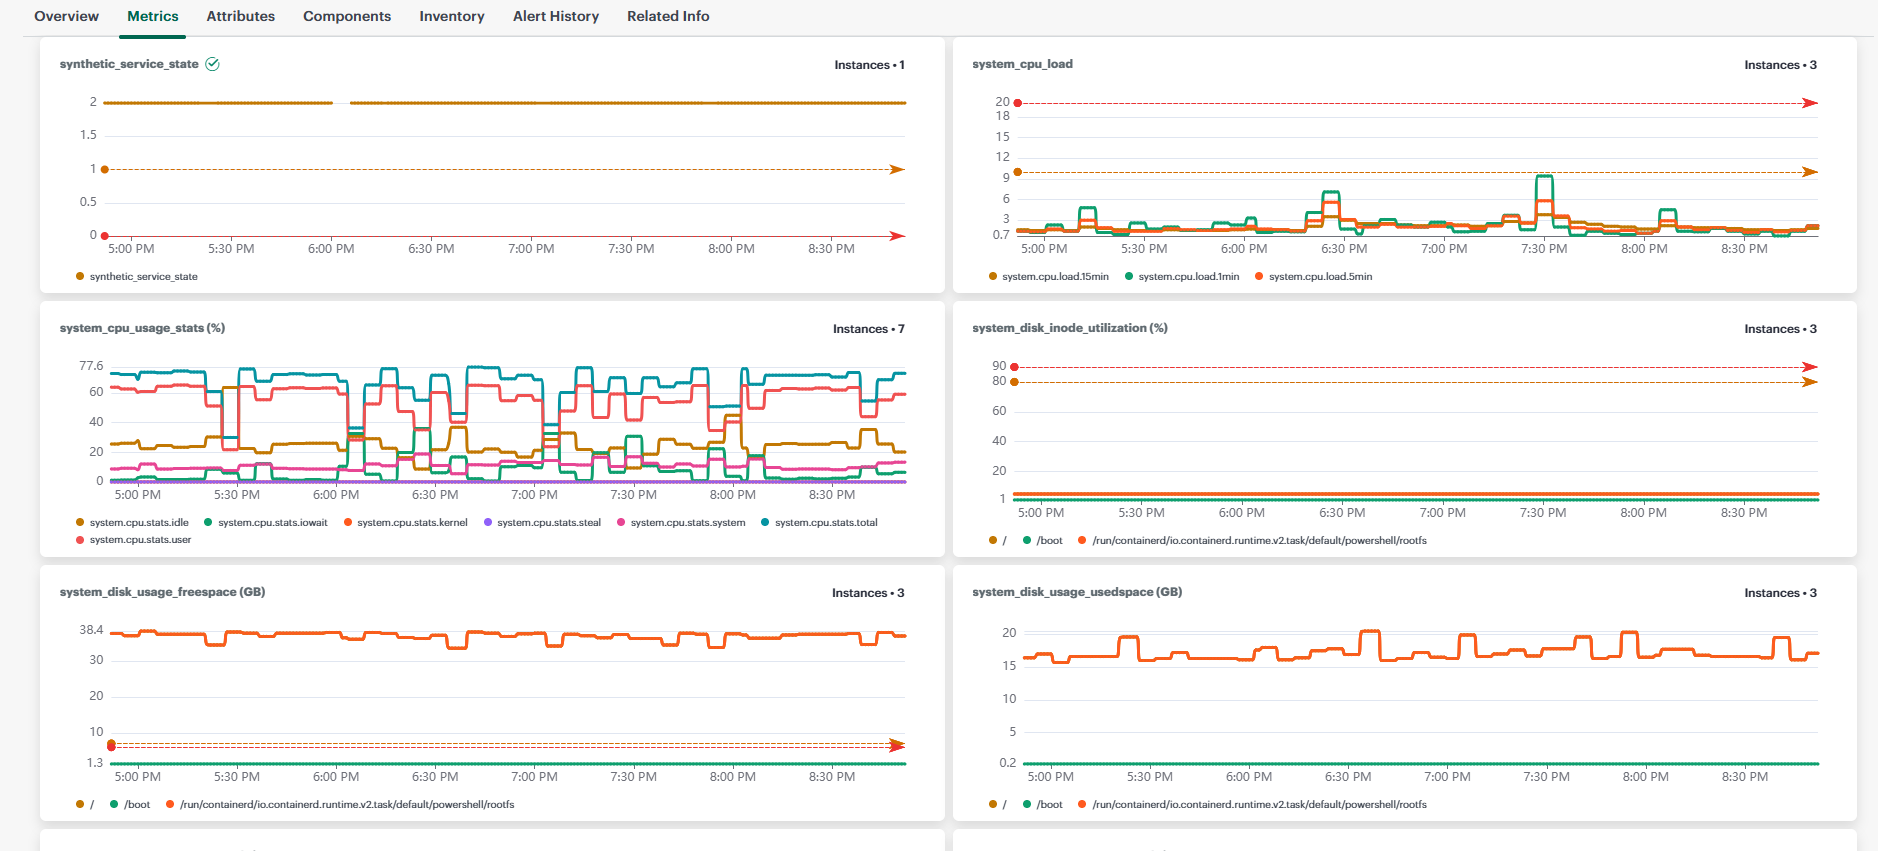
You can view the graph of metrics such as:
- CPU utilization
- Memory utilization
- Disk utilization
- Node uptime
- Network interface utilization metrics
- Click View Monitoring Configuration icon (next to the time filter). The Monitored Metrics tab displays the list of above metrics as well.
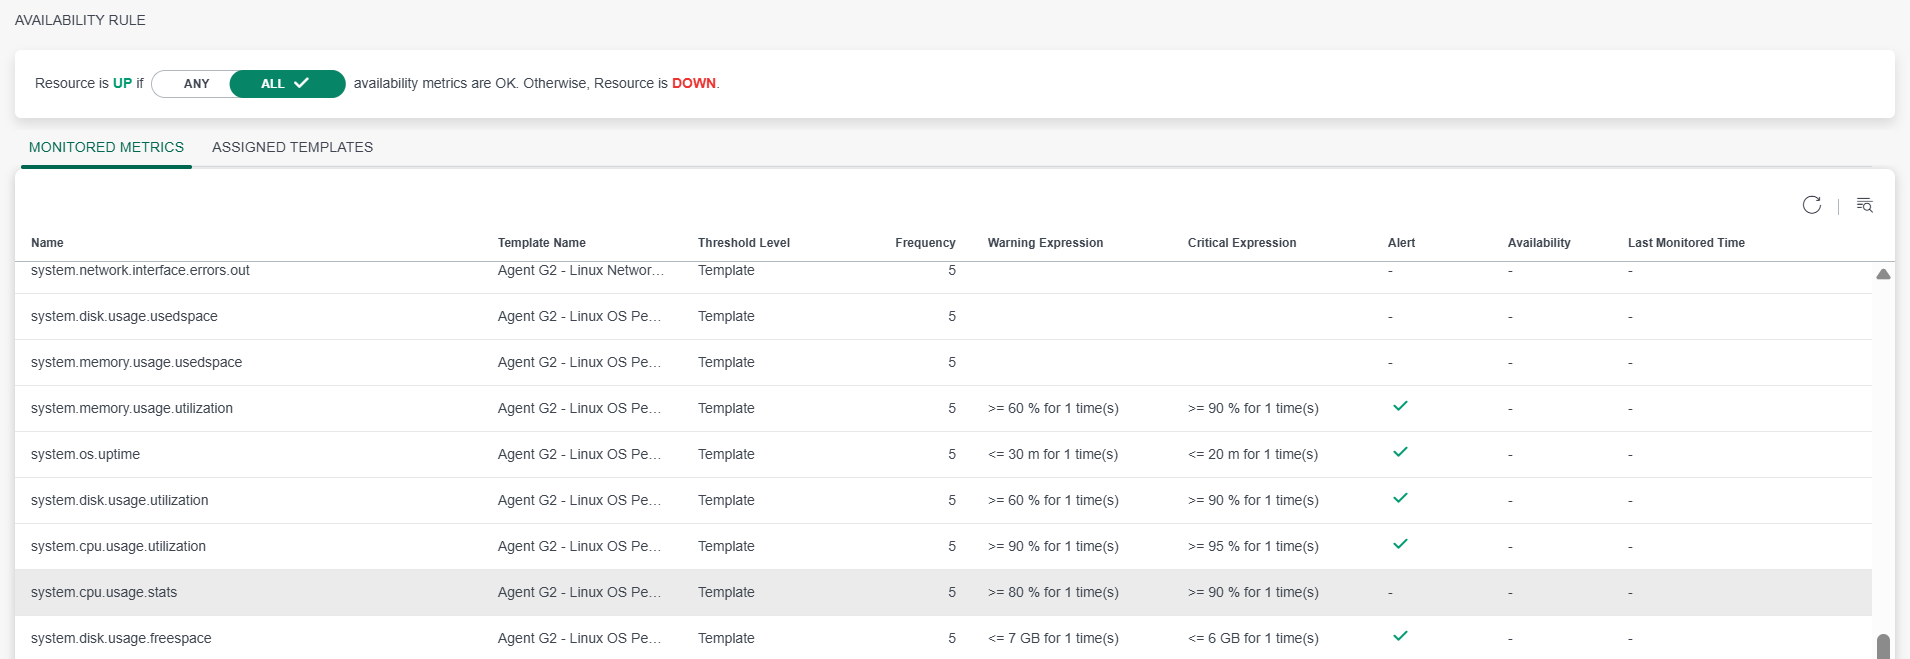
- Click Assigned Templates tab. Agent G2 – Linux OS Performance Monitoring and Agent G2 – Linux Network Monitoring templates are available in the list.
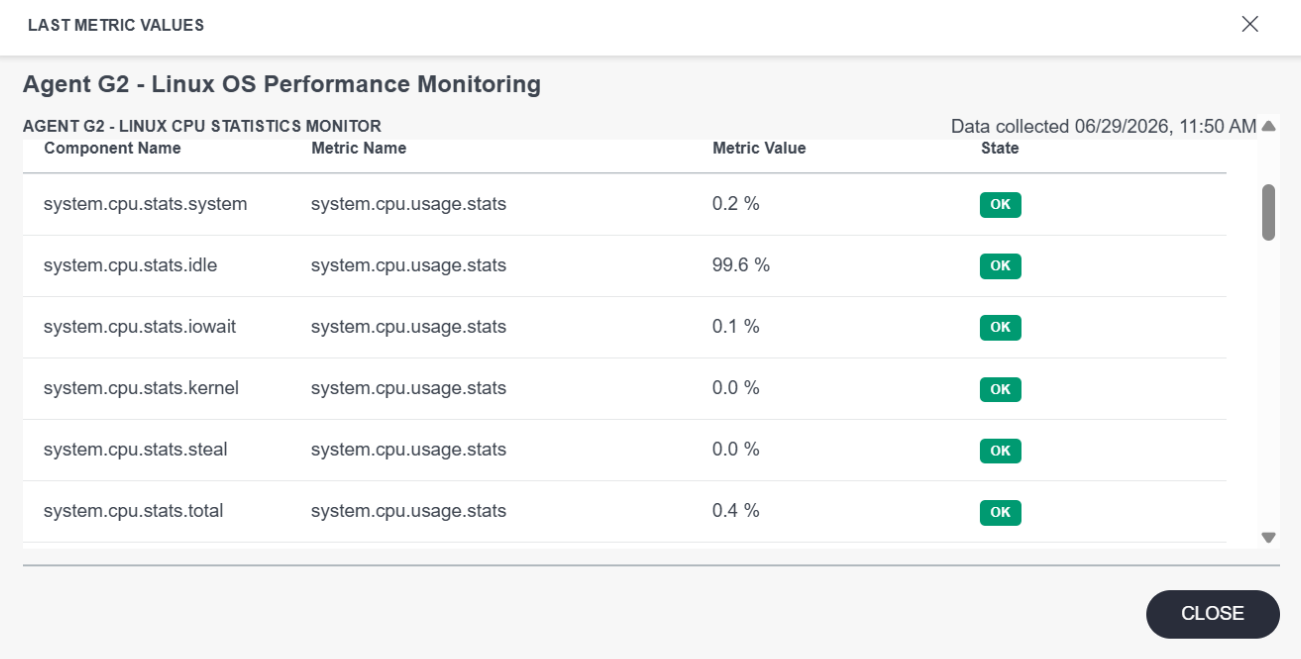
- Click the three dots icon next to the template.
- Select Get Latest Metric Values. The LAST METRIC VALUES popup window is displayed.
Benefits
By automatically collecting gateway capacity metrics, you can:
- Monitor gateway health from a single location.
- Identify CPU, memory, disk, and network resource constraints.
- Detect potential capacity issues before they affect monitoring operations.
- Make informed decisions about scaling gateway resources.
- Improve gateway reliability and reduce the risk of performance-related disruptions.