Introduction
The Traces is your home base where you can view all the ingested traces. You can view the visual representation of all the spans (parent and child spans), save views, and filter your traces to see only those that are relevant to your investigation or specific use case.

Root Entry Spans: The root entry span specifically pertains to the initial spans in a trace that represent the starting points of requests or transactions within the system. This tab gives users a focused view of these initial spans, allowing them to understand the entry points of requests or transactions into the system.
All Spans: This tab typically refers to a view that displays all the spans collected by a tracing system. When a user searches and filters through spans based on various criteria such as service name, operation name, and additional filters, this tab showcases all collected spans that match specified criteria.
| Section | Description |
|---|---|
| Menu | Click to access the Favorite and Quick Links sections. |
| Query | You can also search a trace using +QUERY. The search query consists of attributes, operators and a value. |
| New View | Open a new view using the >+ icon. |
| Refresh | Refresh the page to refresh the page. You can select the time from the drop-down list. The page refreshes based on the time selected. |
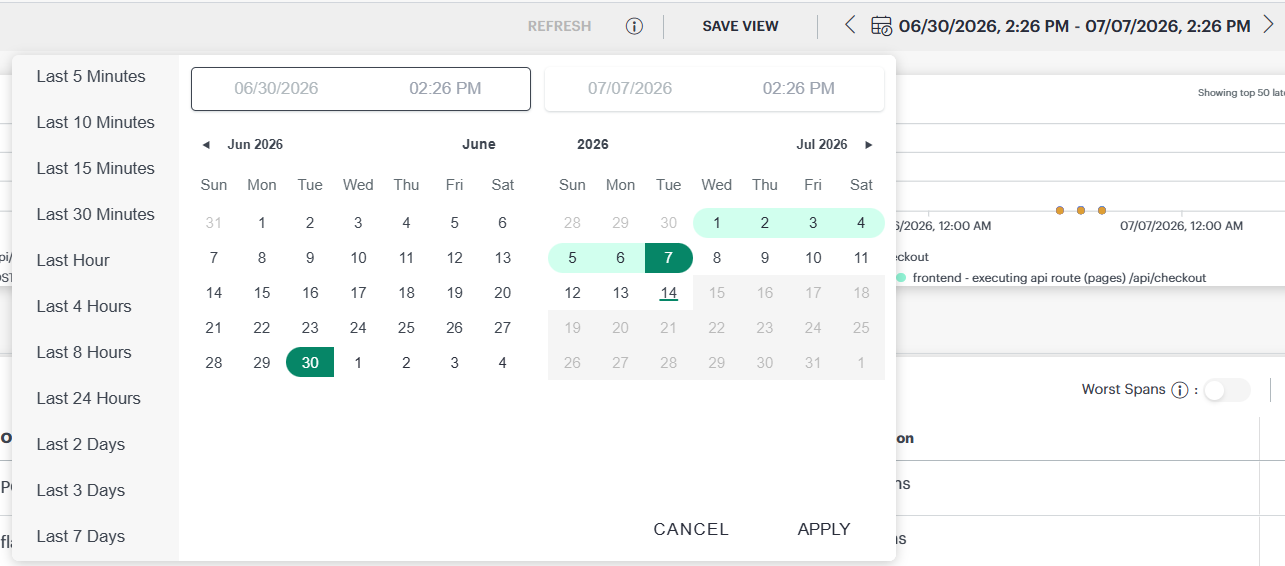
| Filter by duration | You can filter traces using predefined time ranges, such as Last 5 Minutes, Last 1 Hour, Last 24 Hours, Last 2 Days, Last 3 Days, and Last 7 Days. For a custom time range, select the required start and end date/time values using the time-range selector. You can also use the Previous and Next controls to navigate backward or forward through trace data while maintaining the currently selected time-window duration. The displayed start and end timestamps are updated automatically as you navigate. To filter traces:
|
| Trace details | Select the individual traces to display the details in the side panel. |