The system health page gives you the latest information about the availability status of all services, including open incidents and scheduled maintenance tasks.
Get system health summary
To access system health, click the three dots in the right-most part of the menu bar and choose System Health. This opens https://health.opsramp.com/ in your browser.
For each POD, you get a summary view of:
Latest response time and average response time over the last 7 days, in milliseconds.
Percentage uptime over the last 7 days and the last 30 days.
UI, API, and Connection statuses. Possible connection statuses include:
- Service is operating normally
- Service degradation
- Service outage
- No data available
Enter a domain name or URL in the search text box to get information about a domain or URL.
At the bottom of the page, you can choose to view OPEN INCIDENTS or SCHEDULED MAINTENANCE information.
Get more detailed information
In the system health view, click the name of the POD for which you want more detailed information. This displays a detailed information page for the POD:
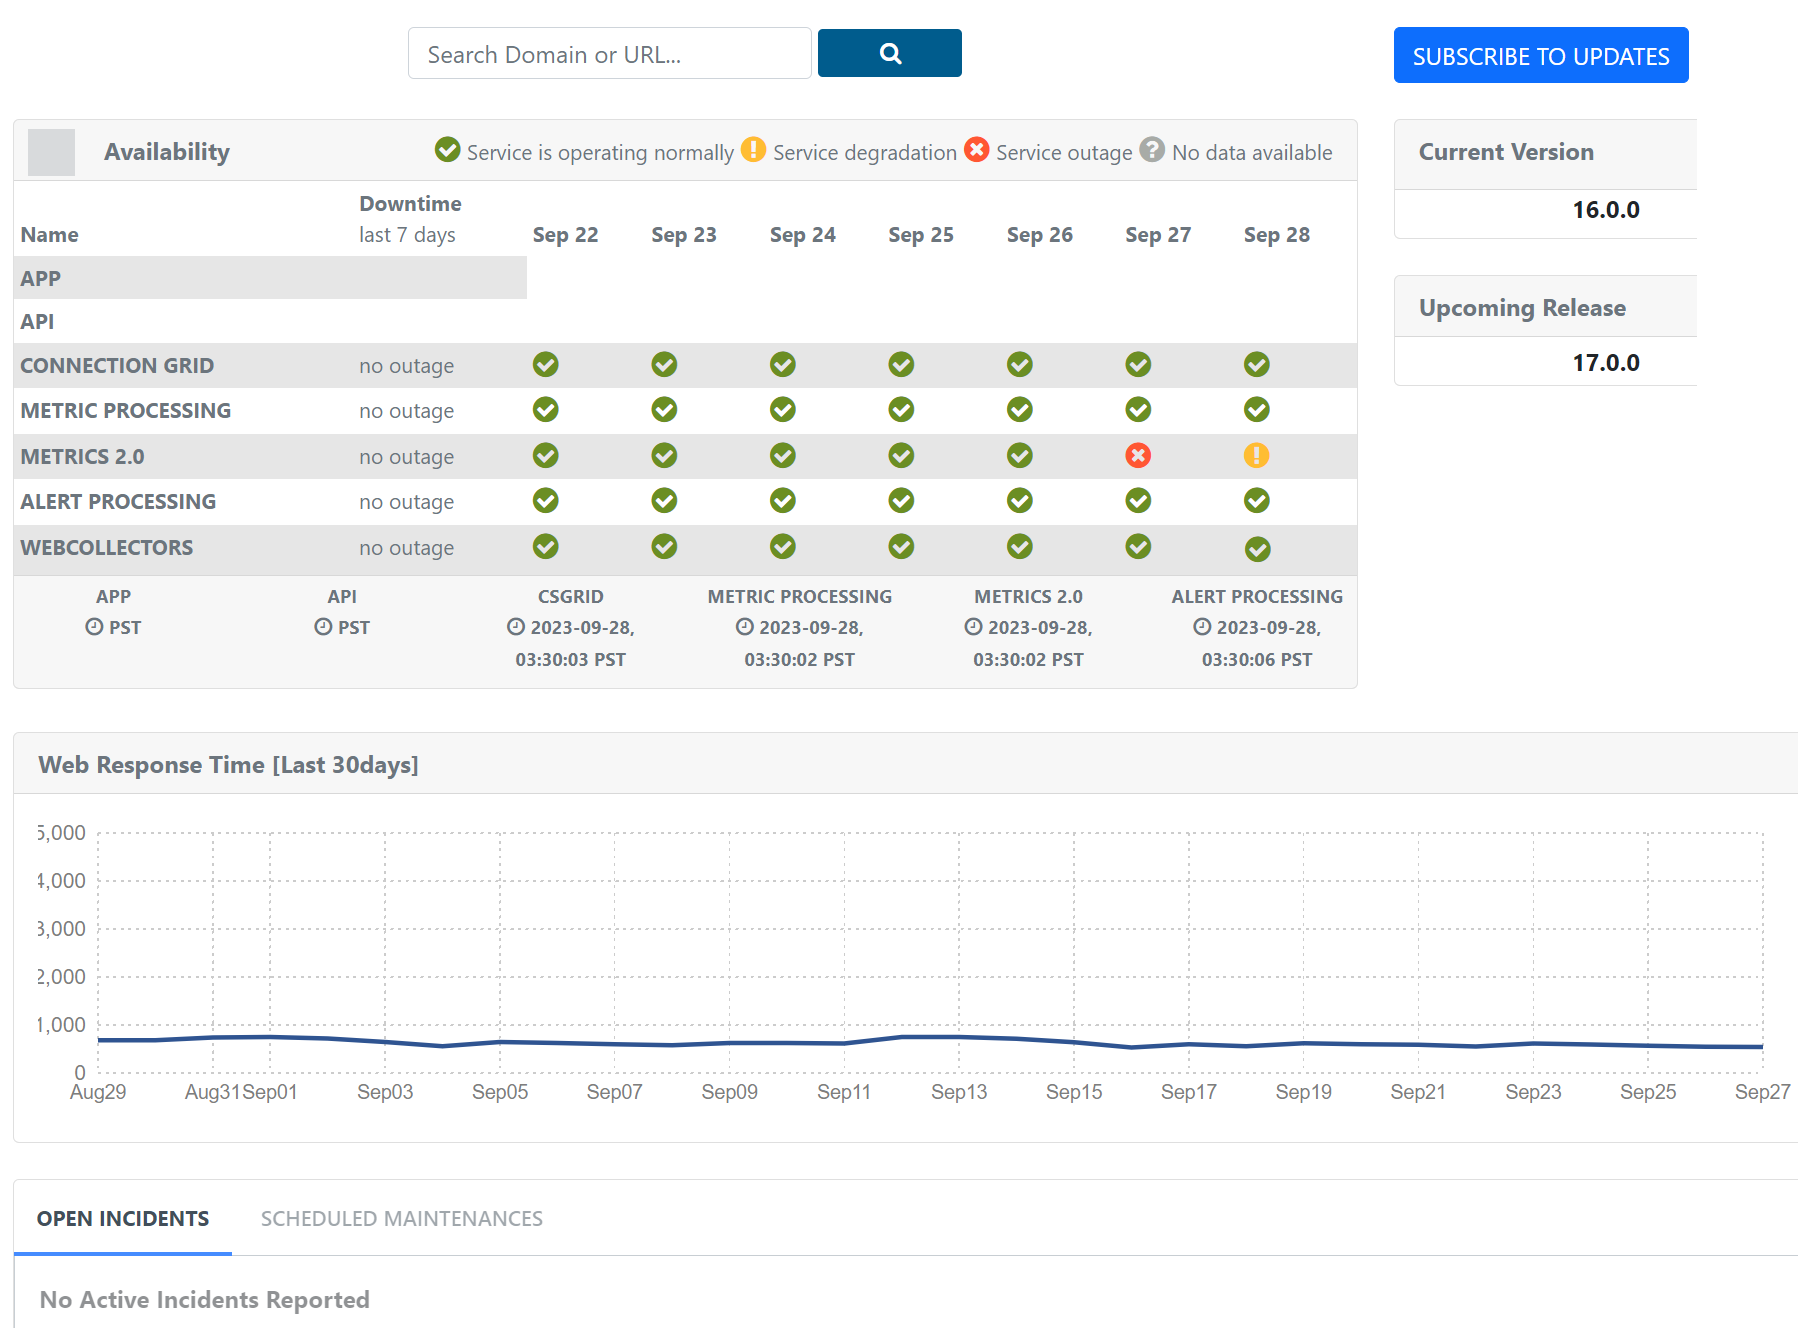
This page shows:
The availability of:
- APP
- API
- CONNECTION GRID
- METRIC PROCESSING
- METRICS 2.0
- ALERT PROCESSING
- WEBCOLLECTORS
A historical graph of web response time.
Open incidents.
Past incidents.
For the incident reports, click Read More to get more detailed information about the incident.
This page also shows the current and next release versions for the POD.
Subscribe to status updates
Click the SUBSCRIBE TO UPDATES button and enter your email address to receive email notifications about status changes.