Introduction
The Netflows Configurations page allows you to configure and manage flow data settings for network monitoring and analysis. It provides centralized controls to define data retention policies, customize metrics, and map network ports for accurate traffic classification.
The page is organized into the following tabs:
- Settings – Configure retention period and data volume limits for flow records.
- Custom Metrics – Define and manage user-specific metrics for advanced traffic analysis.
- Port Mapping – Allows you to assign custom labels to port numbers for easier identification of network services.
Settings
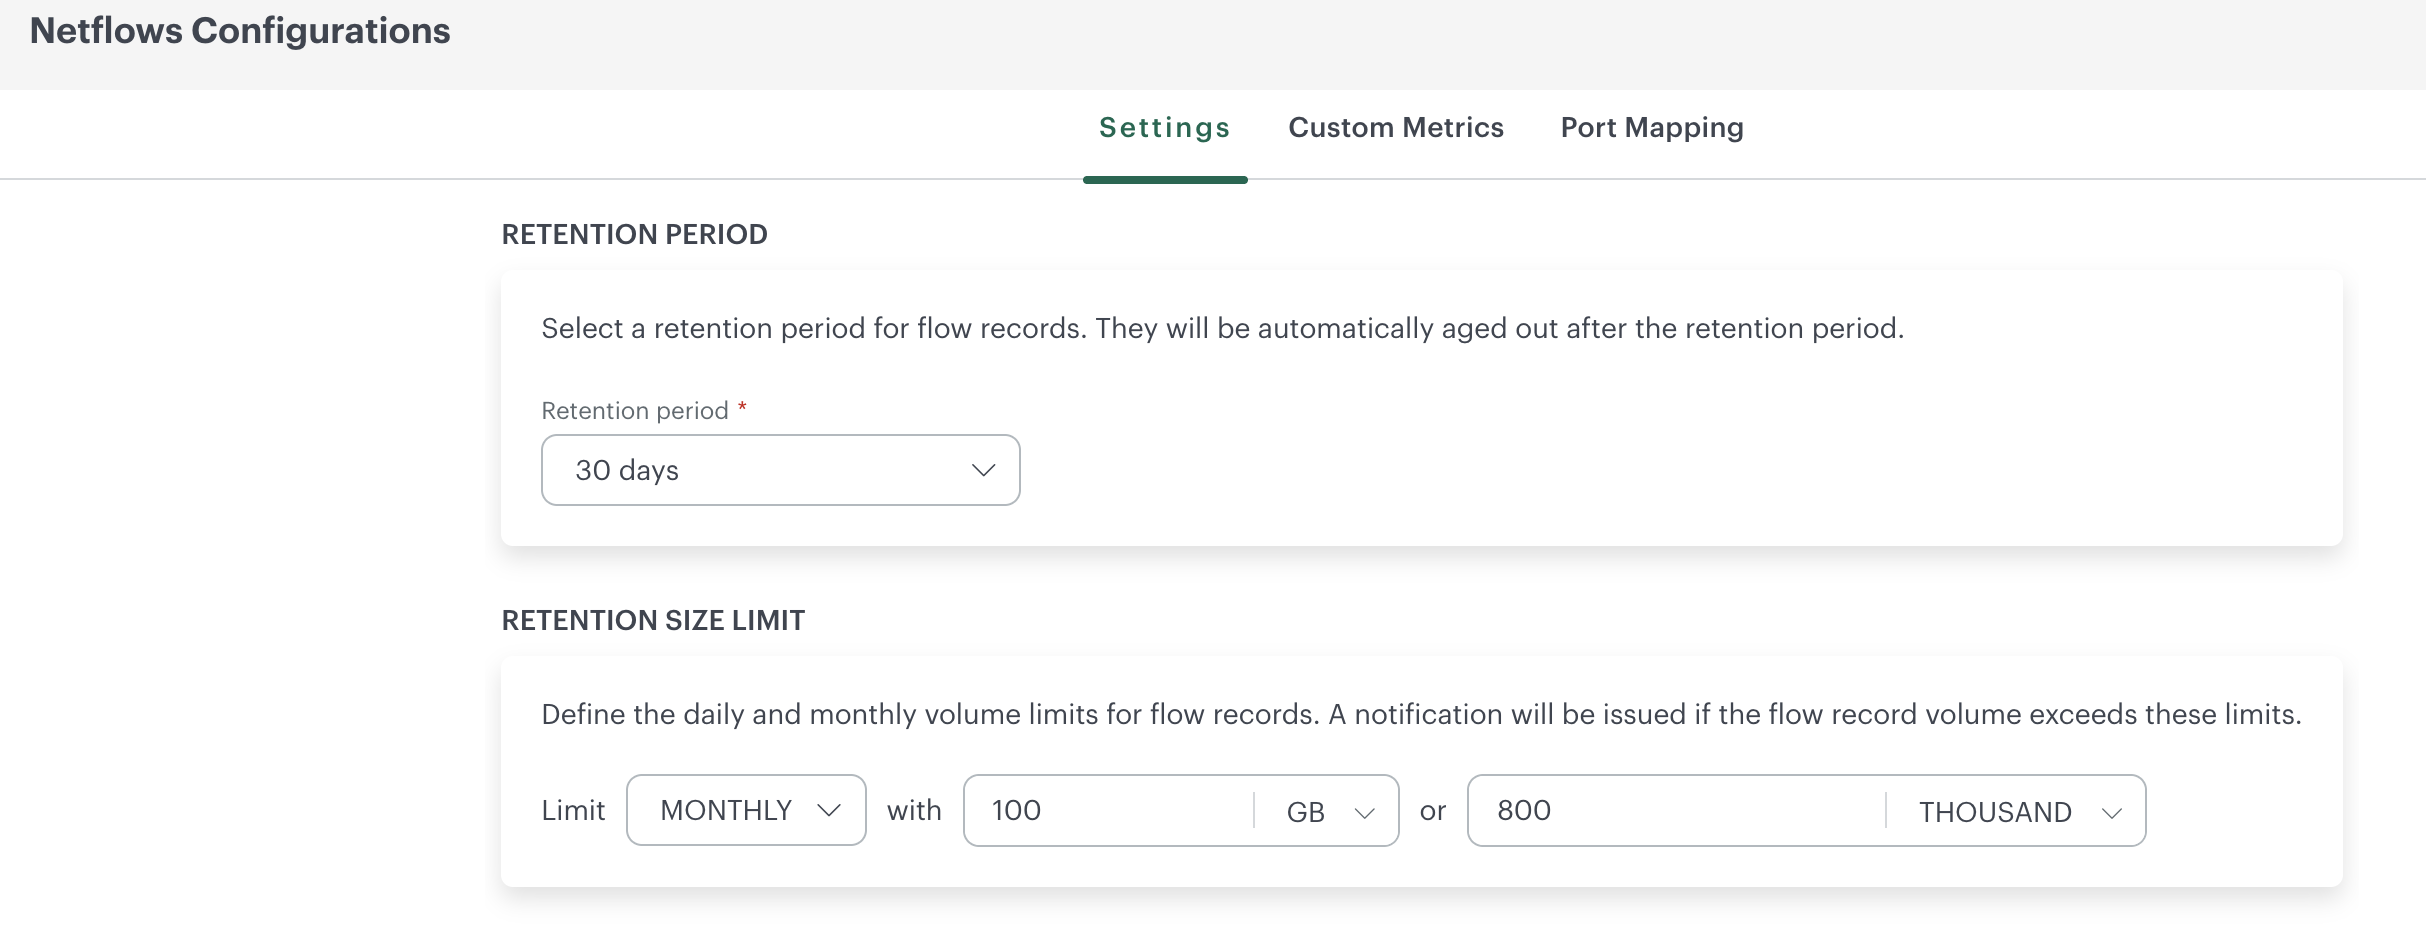
The Settings tab allows you to configure retention policies and storage limits for NetFlow data. These settings help control how long flow records are retained and manage the volume of data collected, ensuring efficient storage utilization and system performance.
You can define:
- Retention Period – Specifies how long flow records are stored before they are automatically aged out.
- Retention Size Limit – Defines daily or monthly volume thresholds for flow data. Notifications are triggered when the configured limits are exceeded.
Retention Period
The retention period specifies how long the flow records are retained in the system before being automatically deleted. The maximum data retention period is 30 days.
You can configure the retention period by selecting the number of days from the drop-down list.
Retention Size Limit
The size or count limit sets a threshold on the amount of storage allocated for storing flow records. You will receive warning/critical notifications when the storage size approaches the specified limit.
OpsRamp will continue to collect data even if the configured data size limit is exceeded. You can monitor data usage by navigating to Dashboard -> NPM Usage/Health Statistics.
For instance, a warning notification is triggered when the size or count reaches 80% of the specified limit, while a critical notification is generated at 90% of the specified limit.
Note
In case both the size and count are configured, an alert will be issued if either of them crosses the threshold.Custom Metrics
Custom metrics in NPM allow you to track specific network conditions by defining unique metrics tailored to your needs. These metrics provide flexibility in monitoring, letting you define custom names, set frequency intervals, and apply filters for targeted data insights.
Once configured, custom metrics can be integrated into dashboards, allowing for real-time visualization and more granular insights across different network layers, application flows, or resource groups.
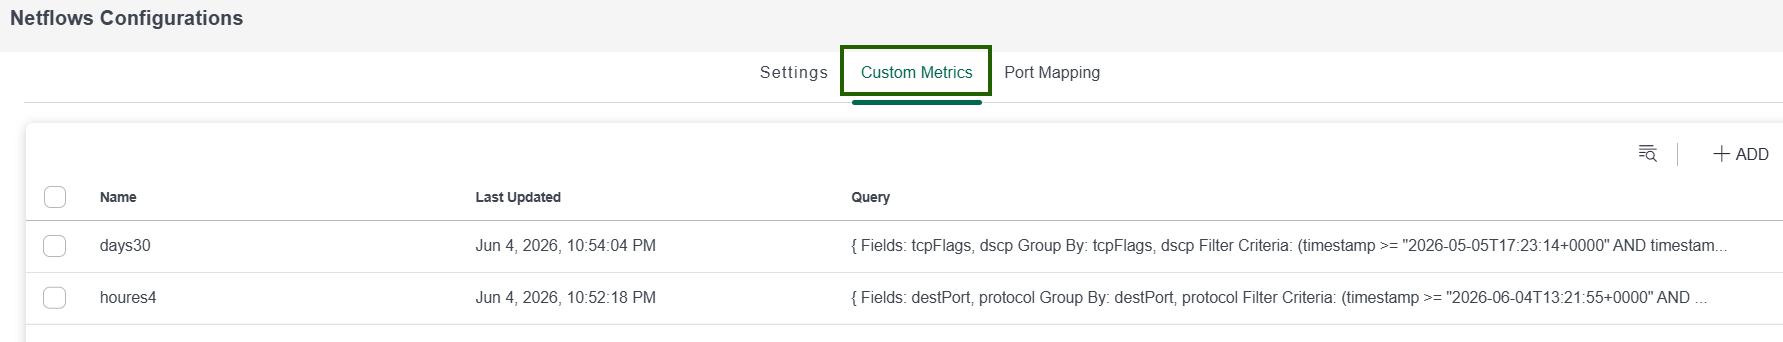
To add a custom metrics:
- Click the Custom Metrics tab.
- On the Custom Metrics screen, click the +Add button to create a new custom metric.
- Provide below metric details:
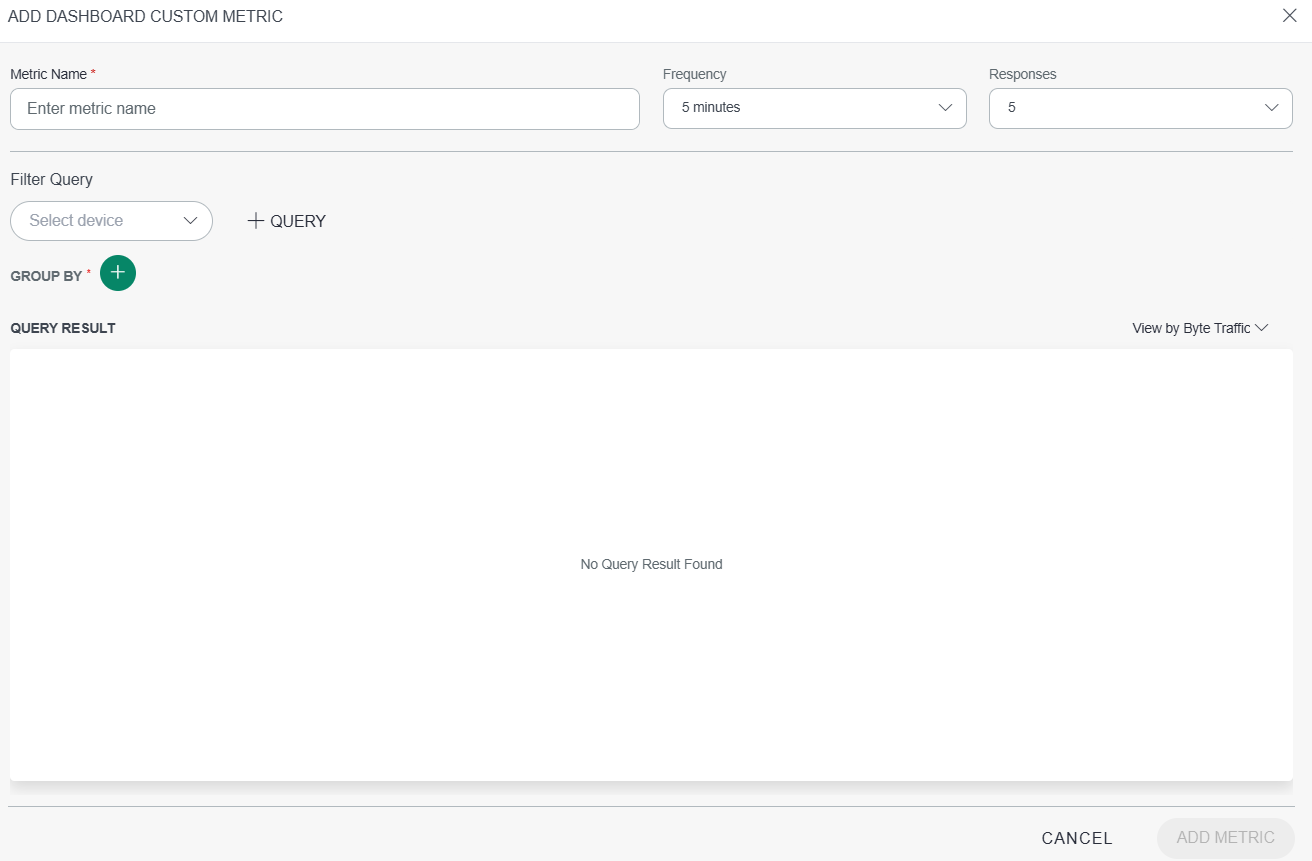
- Metric Name: Enter a unique name for the metric.
- Frequency: Set the frequency for data collection. By default, this is set to 5 minutes.
- Filter Query: Specify the criteria for devices you want to include in this metric by selecting the appropriate filters.
- Group By: Choose attributes by which the data should be grouped, providing a focused view of the metrics data.
- Query Result: Review the results based on your filter criteria to ensure they meet your monitoring requirements.
- Click ADD METRIC to complete the setup, adding the custom metric to your dashboard for tracking and alerts.The new custom metric will be available in the dashboard, allowing for real-time monitoring based on your specifications.
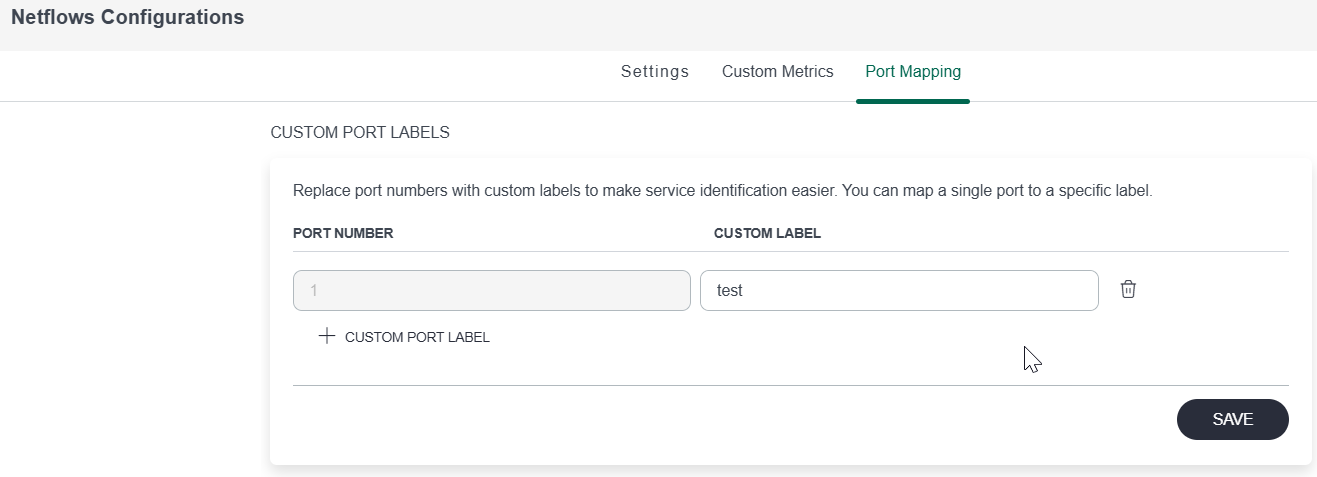
Port Mapping
Custom Port Mapping allows users to assign labels to specific port numbers, simplifying the identification and monitoring of services. By mapping a single port to a custom label, you can quickly recognize and track specific applications or services on the network. This feature enhances clarity on the NPM dashboard by replacing standard port numbers with easily identifiable names, helping to streamline troubleshooting and performance analysis.