Metrics Explorer provides a centralized interface for finding, visualizing, and analyzing client metrics. Use the Metrics Explorer UI to search for metric names or keywords, view relevant metric tiles, apply filters, adjust time ranges, and investigate metric behavior in context.
Note
This feature is available only at the client level.Access the Metrics Explorer
To access Metrics Explorer, follow these steps:
- On the Dashboards screen, select your client from the Client/Partner list in the upper-left corner. Type the client name in the search bar or select it from the list.
- Navigate to Infrastructure > Metrics.
- The Metric Explorer page appears with a metric search bar.
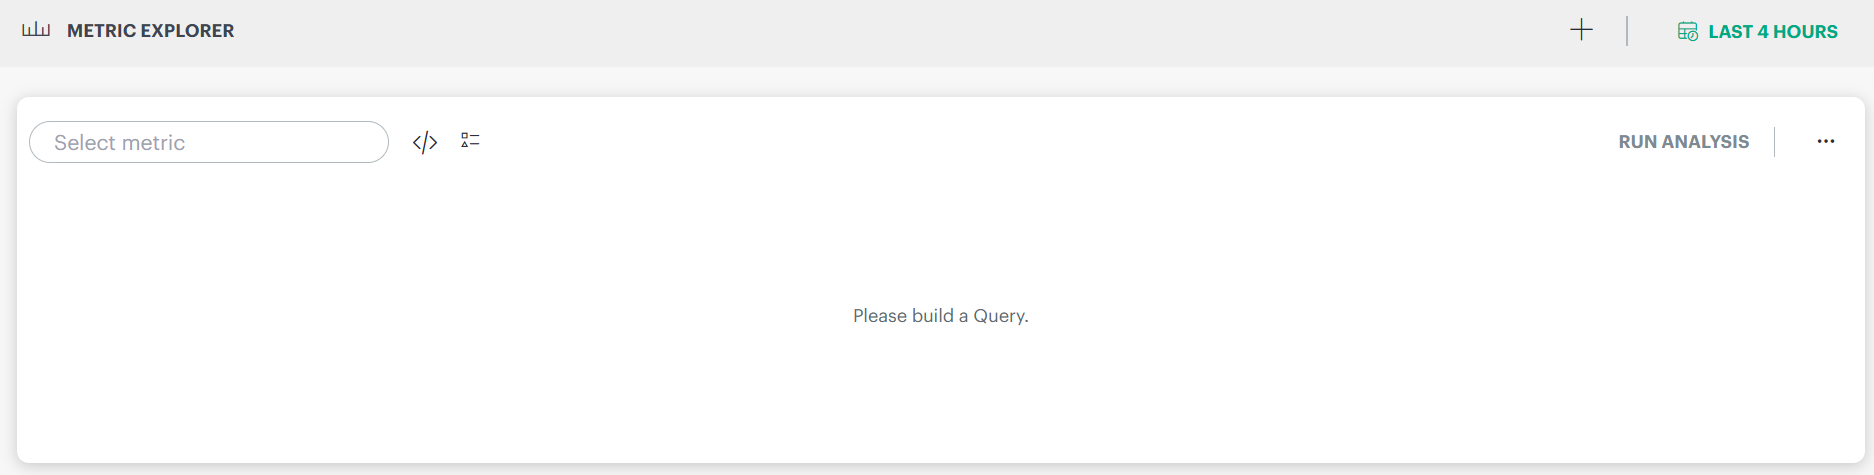
- Enter a metric name or keyword in the search bar, or select a metric from the list as you type. You can use Basic or Advanced query mode. The search list displays PromQL-supported metrics.
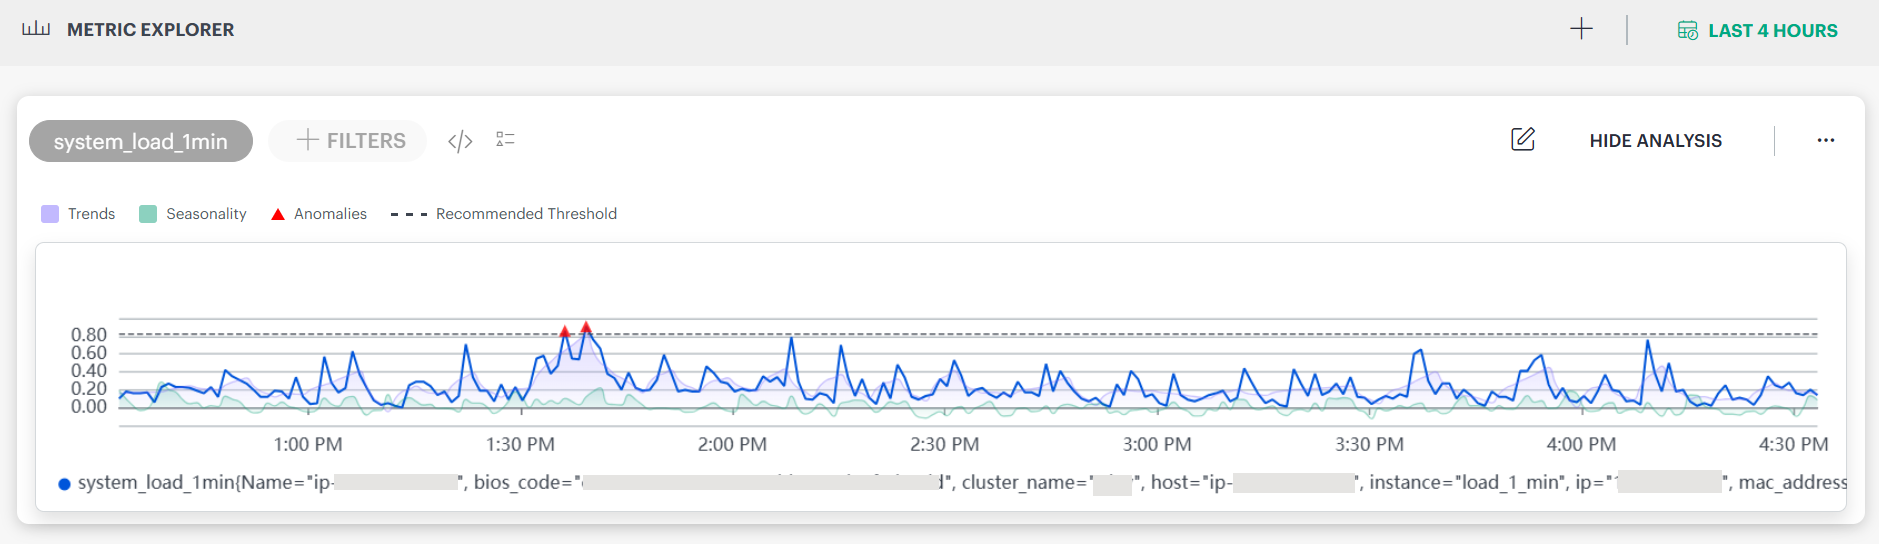
- A metric visualization appears.
Metric Explorer Controls
After selecting a metric, use the following controls in Metric Explorer:
- Use + Filters to apply label-based filters, such as host, uuid, instance, and other metric labels.
- Click RUN ANALYSIS to perform an automated analysis of the selected metric.
- A single metric tile can display multiple time series, each in a different color.
- If a metric displays more time series than can fit in the legend, use the legend pagination controls to view the remaining series.
- Use the ellipsis (…) icon to add metric tile to dashboard, create a duplicate tile, or remove a tile.
- Use the time range selector in the upper-right corner of the page to select a time range. By default, metric tiles display data for the previous four hours.
Supported ranges include the following:Last Hour Last 4 Hours Last 8 Hours Last 12 Hours Last 24 Hours Last 2 Days Last 3 Days Last 7 Days Last 15 Days Last 30 Days
×![]()