Metrics Explorer enables you to analyze metric data with advanced analytics and visualizations.
This guide explains how to run automated time-series analysis to detect anomalies, identify trends, and discover seasonal patterns. It also explains how to add metric tiles to dashboards. Analysis uses one month of historical data to help you understand metric behavior, establish recommended thresholds, and make data-driven decisions about alert configuration and performance investigations.
About Metrics Analysis
Metrics Explorer analysis examines historical metric data to help you understand how a metric behaves over time. It evaluates the selected metric for trends, recurring seasonal patterns, and values that differ significantly from its typical behavior. The results include trend direction, seasonality, detected anomalies, and a recommended threshold.
Why Run Analysis?
Running analysis helps you:
- Identify gradual changes or shifts in workload before they become service-impacting issues.
- Recognize recurring patterns so that normal seasonal behavior is not mistaken for an anomaly.
- Investigate unusual metric values and understand their severity.
- Establish a historical baseline and use the recommended threshold as guidance when tuning alerts.
Run Metrics Analysis
Note
A PromQL query can return a maximum of 12 series. Analysis cannot run when a query returns more than 12 series. Apply additional filters to limit the query results to 12 or fewer series.To run analysis on a metric:
- Navigate to the metric visualization graph.
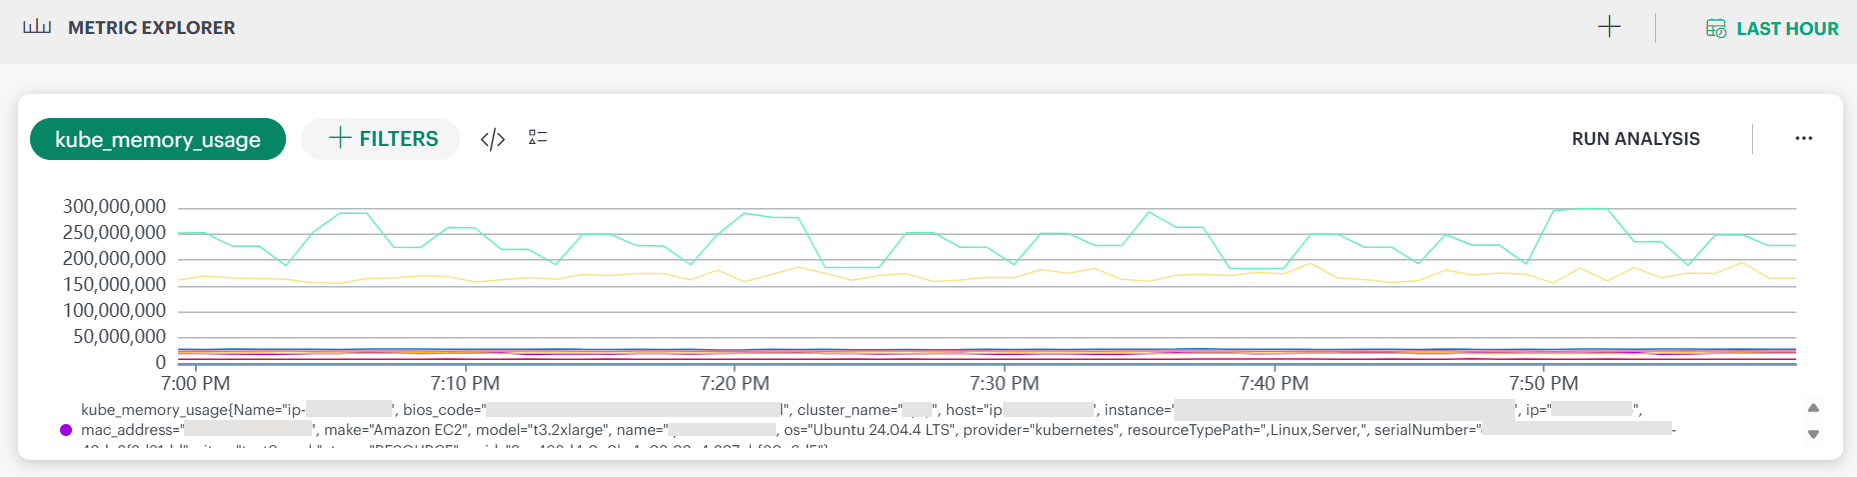
- Click RUN ANALYSIS. Metrics Explorer performs an automated time-series analysis on the selected metric and displays one or more analysis views.
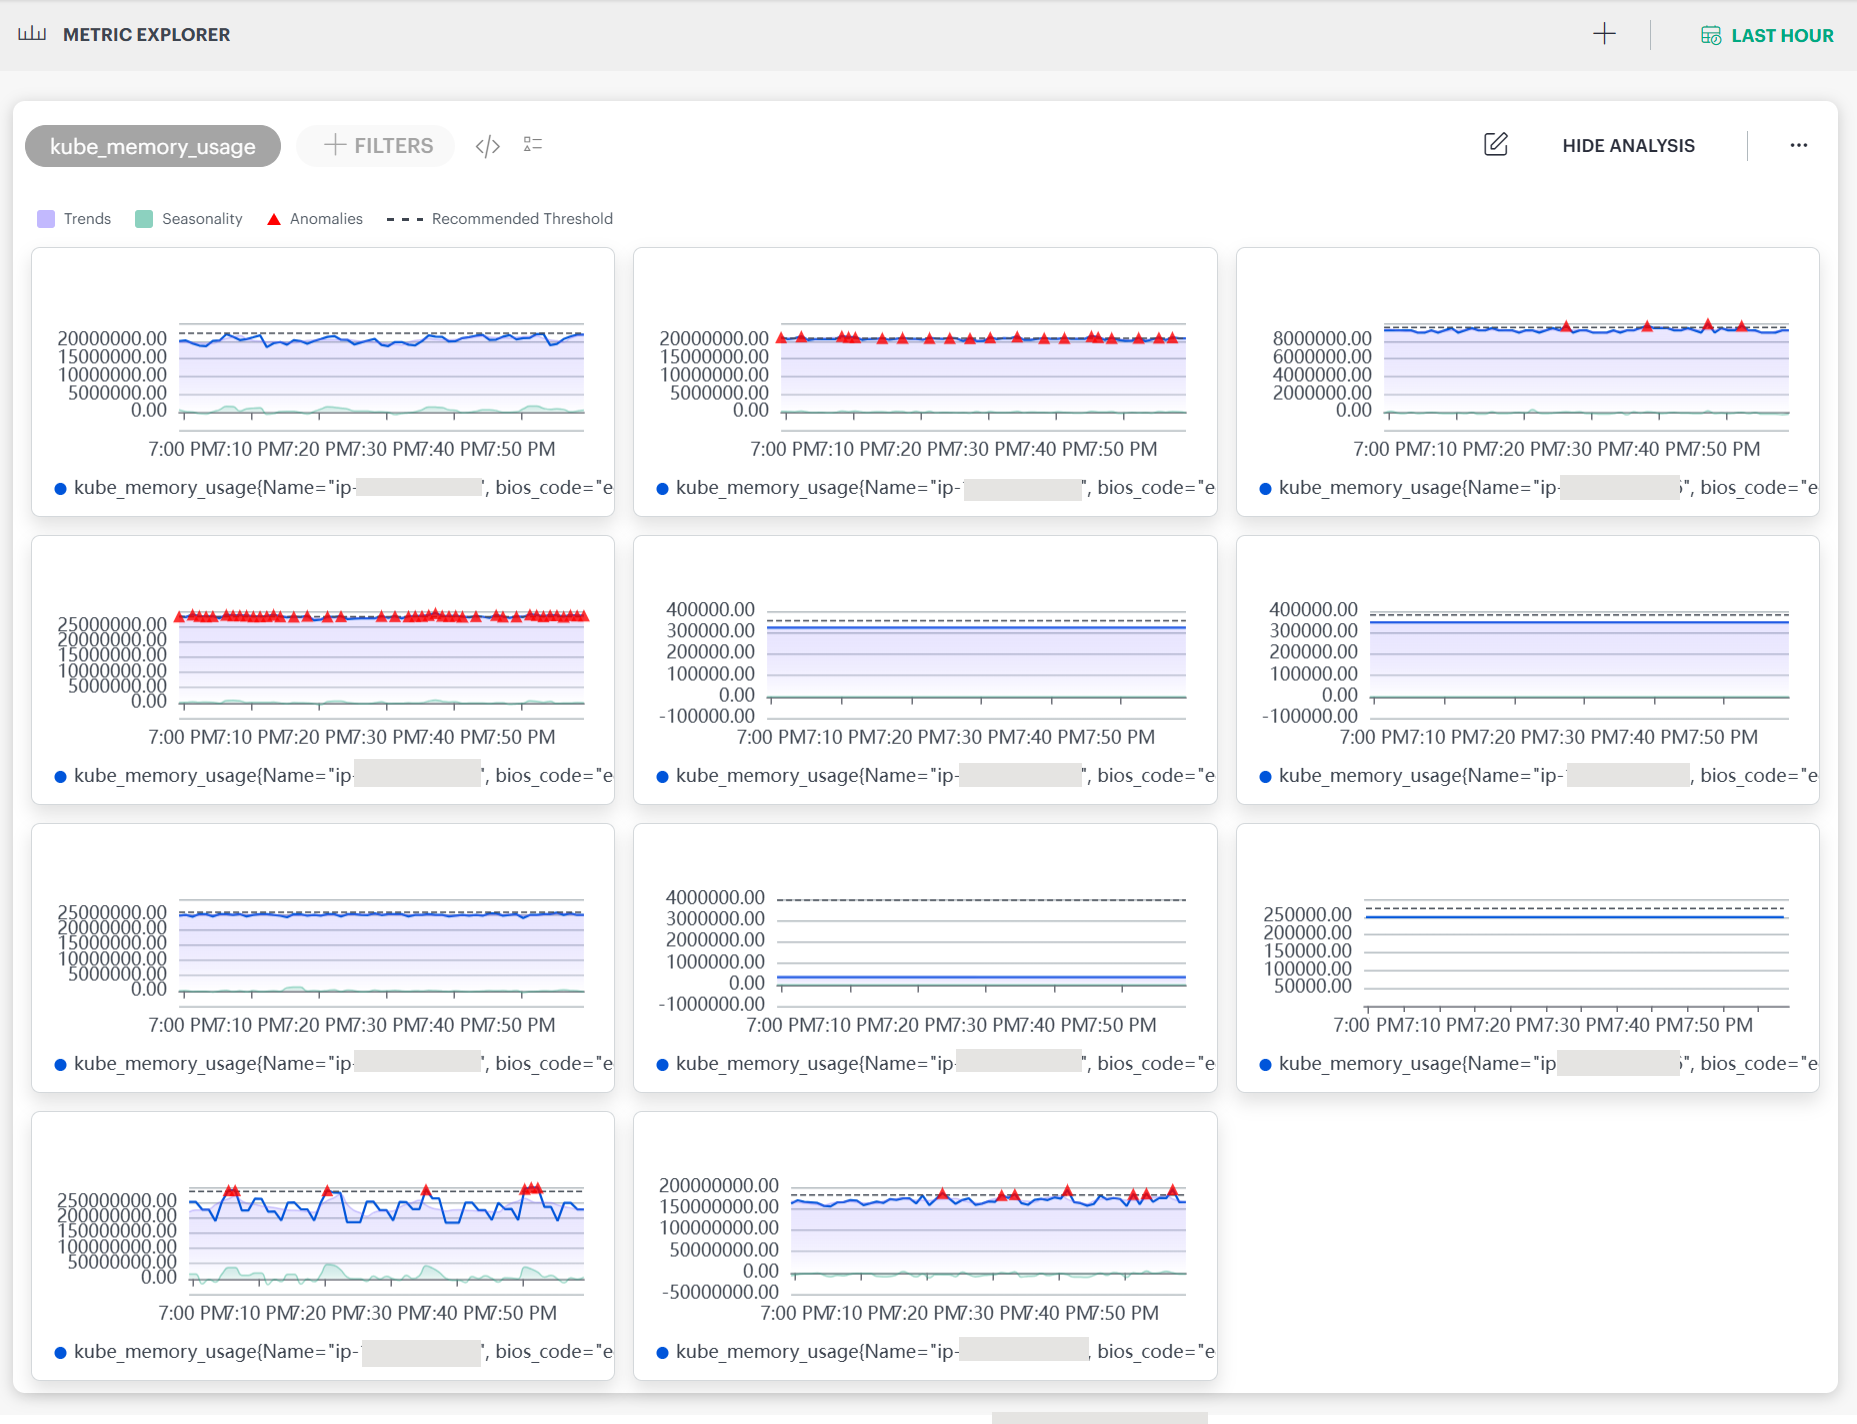
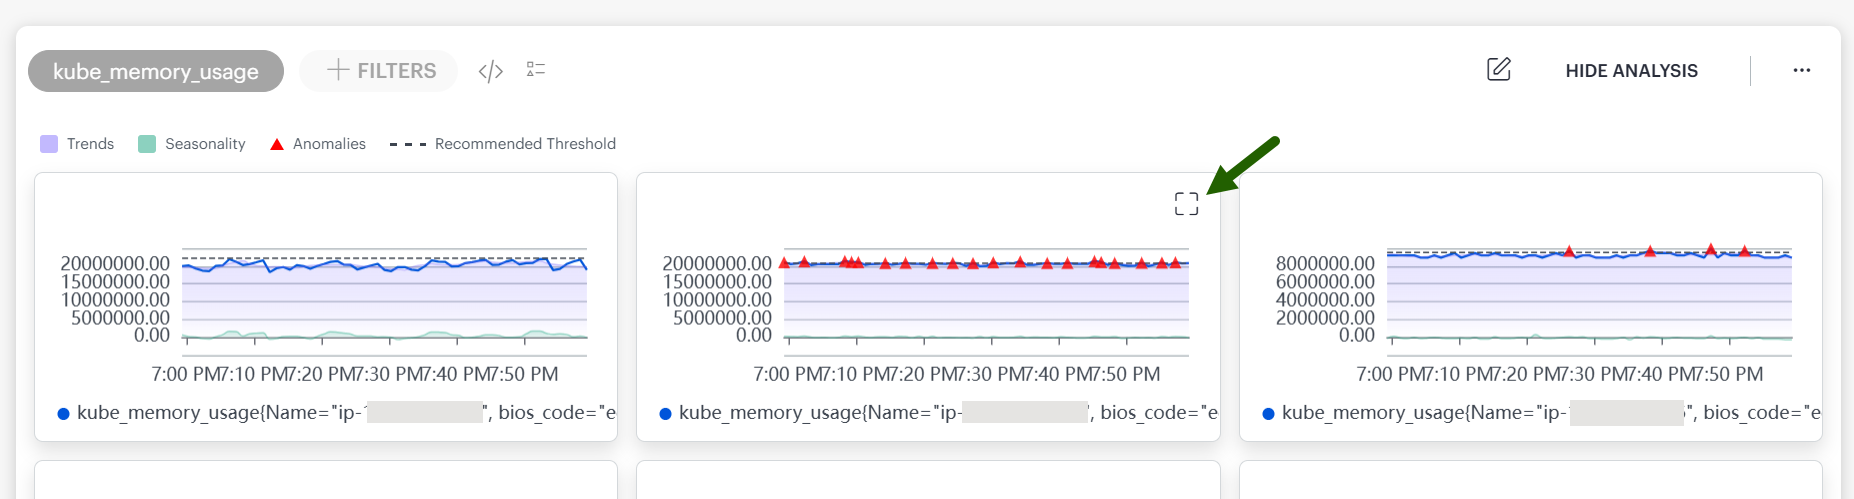
- Click the full-screen icon to expand the visualization.
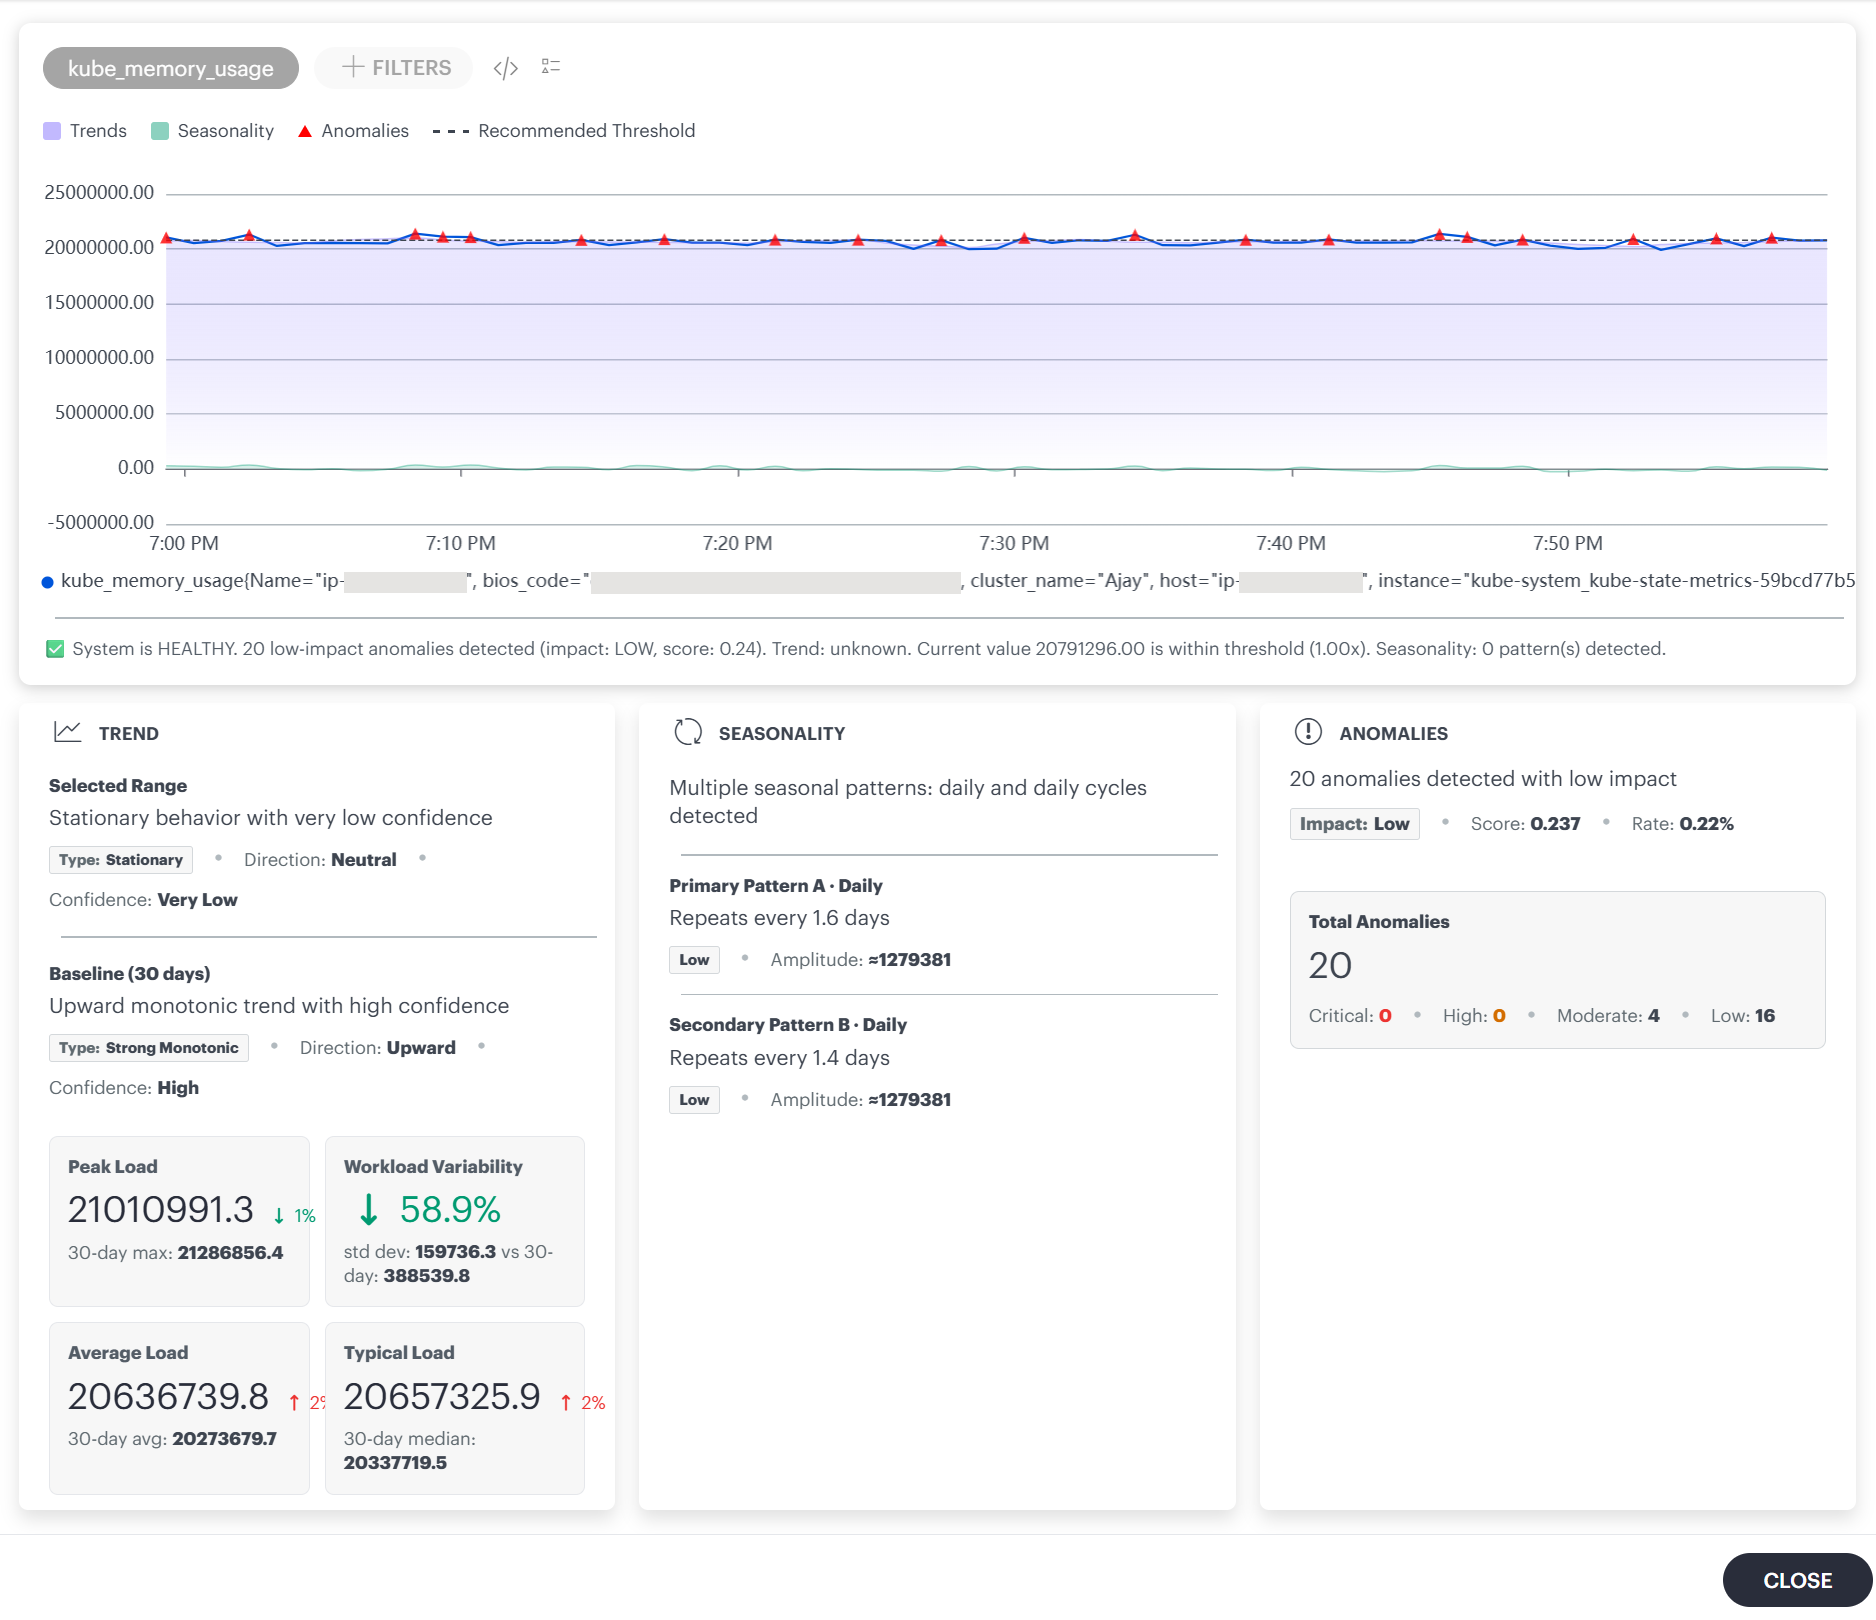
- Scroll down to view the Trend, Seasonality, and Anomalies analysis results.
How Metrics Analysis works
Analysis is performed using:
- The last one month of metric data.
- Data collected at one-minute intervals (approximately 43,200 data points).
- The currently selected filters and time range.
Note
Anomalies and seasonal patterns might not be detected when the selected time range contains insufficient data, extended gaps, or inconsistent data points. Select a longer time range with sufficient, continuous data to improve analysis accuracy.To hide the analysis view, click HIDE ANALYSIS.
Analysis Parameters Explained
The following parameters are displayed as part of the analysis results:
Trend
The Trend section describes the metric’s behavior for the selected time range and for the 30-day baseline. The selected range and baseline can produce different results. For example, the selected range may show stationary behavior with very low confidence, while the 30-day baseline shows an upward monotonic trend with high confidence.
Trend results include the following:
| Parameter | Description |
|---|---|
| Selected Range | Trend type, such as stationary, and its confidence for the current time selection. |
| Type | Classification of the trend, such as Stationary or Random Walk. |
| Direction | Overall movement of the metric, such as Neutral or Upward. |
| Confidence | Confidence level for the trend classification and direction. For example, Very Low, Very High. |
| Baseline (30 days) | Trend type, direction, and confidence calculated from the 30-day baseline. |
| Peak Load | Highest observed load and its percentage change. |
| Workload Variability | Variation in the metric values, shown as a percentage. |
| Average Load | Average value of the metric over the selected time range. |
| Typical Load | Typical value of the metric under normal operating conditions. |
Seasonality
The Seasonality section identifies repeating patterns in metric behavior. It can display multiple patterns, such as primary and secondary daily cycles. Each pattern includes its frequency, confidence or impact level, and amplitude. For example, a result may report that daily patterns repeat every 1.6 days and 1.4 days.
Seasonality details include the following:
| Parameter | Description |
|---|---|
| Primary Pattern | Dominant repeating pattern, including its frequency, severity, and amplitude. |
| Secondary Pattern | Additional repeating pattern detected in the metric data, including its frequency, severity, and amplitude. |
Anomalies
The Anomalies section summarizes values that differ significantly from expected metric behavior. It displays the total number of anomalies, their overall impact, an anomaly score, and the anomaly rate. It also provides a severity breakdown. For example, a result can show 20 anomalies with low impact, a score of 0.237, a rate of 0.22%, and 4 moderate and 16 low anomalies.
Anomalies are detected using adaptive thresholds based on metric volatility and one month of historical data. Missing values are interpolated for analysis, with up to 20% missing data supported.
Note
If there are low-impact anomalies or no anomalies, the system is considered Healthy.Anomaly details include the following:
| Parameter | Description |
|---|---|
| Total Anomalies | Total number of anomalies detected in the analyzed metric data. |
| Impact | Overall impact level, such as Low, Moderate, High, or Critical. |
| Score | Computed anomaly score indicating the magnitude of the detected deviations. |
| Rate | Percentage of analyzed data points identified as anomalous. |
| Anomaly Count by Severity | Breakdown of anomalies by Critical, High, Moderate, and Low severity. |
Recommended Threshold
The recommended threshold is a system-generated anomaly threshold derived from historical behavior.
- Calculated using volatility analysis combined with a clustering algorithm.
- Values above this threshold are considered potential anomalies.
- Provided as advisory guidance for investigation and alert tuning.
Note
Automatic Alert generation based on adaptive thresholds is not currently enabled. It will be introduced in a future release.Anomaly Impact Reference
| Impact Level | Color | Description |
|---|---|---|
| CRITICAL | Red | Severe deviation from baseline. Immediate investigation is recommended. |
| HIGH | Orange | Significant behavior change. Validate service impact and correlated alerts. |
| MODERATE | Yellow | Noticeable deviation. Track trend continuity and recurrence. |
| LOW | Blue | Minor variation. Usually informational unless repeated frequently. |
Manage metric tiles
You can add metric tiles to dashboards, duplicate existing tiles, or remove tiles you no longer need. The following sections describe each operation.
Add to Dashboard
The Add to dashboard functionality allows you to add metric tiles from Metrics Explorer to a dashboard.
Follow these steps to add a tile to a dashboard:
- On the Dashboards screen, select your client from the Client/Partner list in the upper-left corner. Type the client name in the search bar or select it from the list.
- Navigate to Infrastructure > Metrics.
- The Metric Explorer page appears with a metric search bar.
- Enter a metric name or keyword in the search bar, or select a metric from the list as you type. You can use Basic or Advanced query mode. The search list displays PromQL-supported metrics.
- A metric visualization appears.
- Click the ellipsis (…) icon in the upper-right corner of the page, and then select Add to dashboard.
- Modify the query or visualization as needed.
- Click Add to Dashboard, and select the dashboard where you want to add the tile.
- Click Add Tile. The tile is added to the dashboard, and a confirmation message appears.
Verification:
- Navigate to Dashboards > Dashboard.
- On the Dashboards page, click the menu icon.
- Select the dashboard where you added the tile. The metric tile is displayed.
Duplicate
Use the Duplicate option to create a copy of a metric tile.
Follow these steps to duplicate a metric tile:
- Click the ellipsis (…) icon at the right top corner of the Metric Explorer page.
- Select Duplicate.
- A duplicate metric tile is created. You can modify the query parameters as required.
Remove
Use the Remove option to remove a metric tile from the Metric Explorer page.
Follow these steps to remove a metric tile:
- Click the ellipsis (…) icon in the upper-right corner of the Metrics Explorer page.
- Select Remove.
- The metric tile is removed from the page.