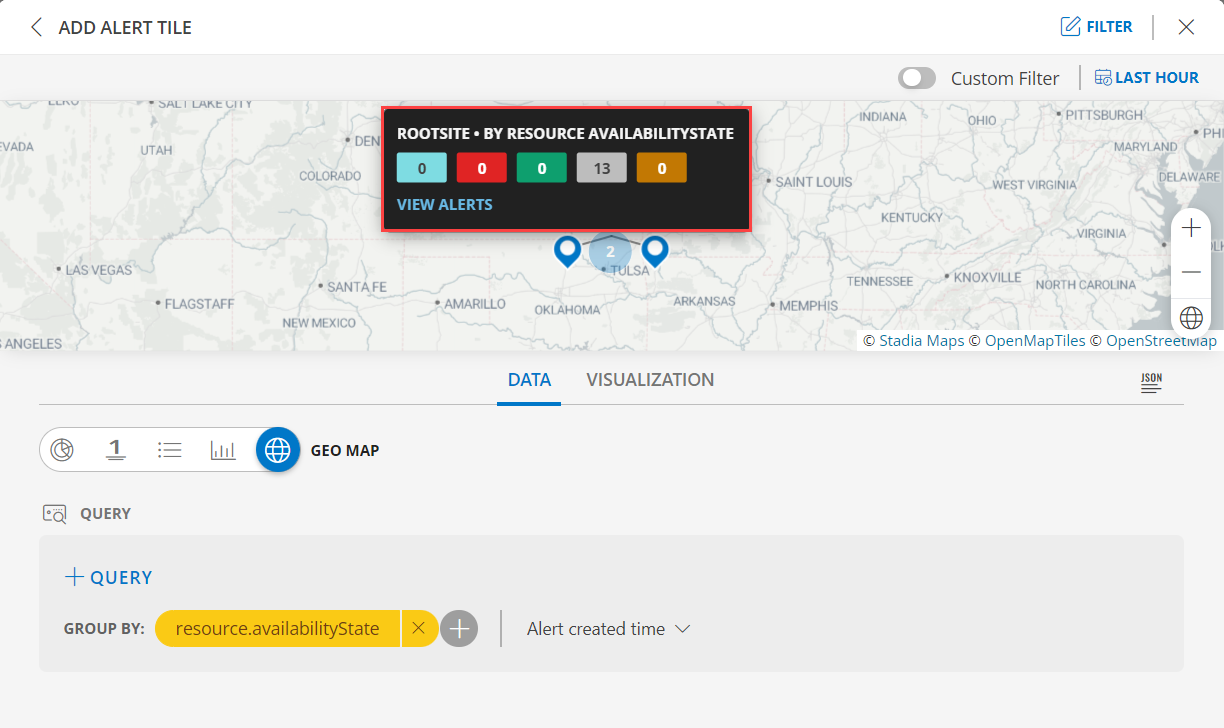
Geomap Visualization for Alert Tile
Geomap Visualization View
The Geomap visualization feature enables users to efficiently analyze and understand location-specific data with a quick glance. By integrating a Geomap into Dashboard 2.0, users can visually depict the distribution of resources based on site location.
For users interested in viewing resources scattered across locations, it is recommended to associate the resource with a site. Refer to the Group Resources by Location documentation to learn more about creating a site and effectively managing resource grouping based on their geographical locations.
The following is the visualization with the inputs:
- Group By:
resource.location
Notes:
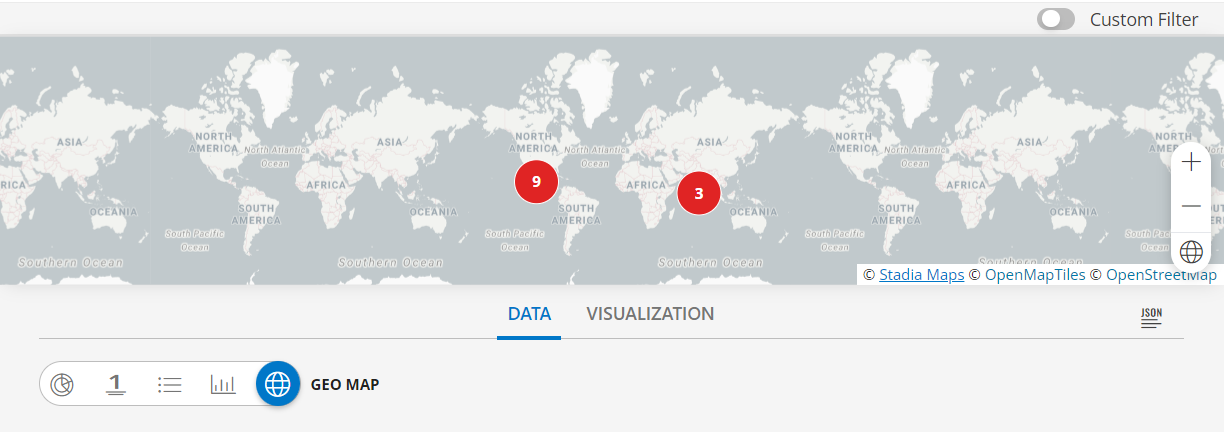
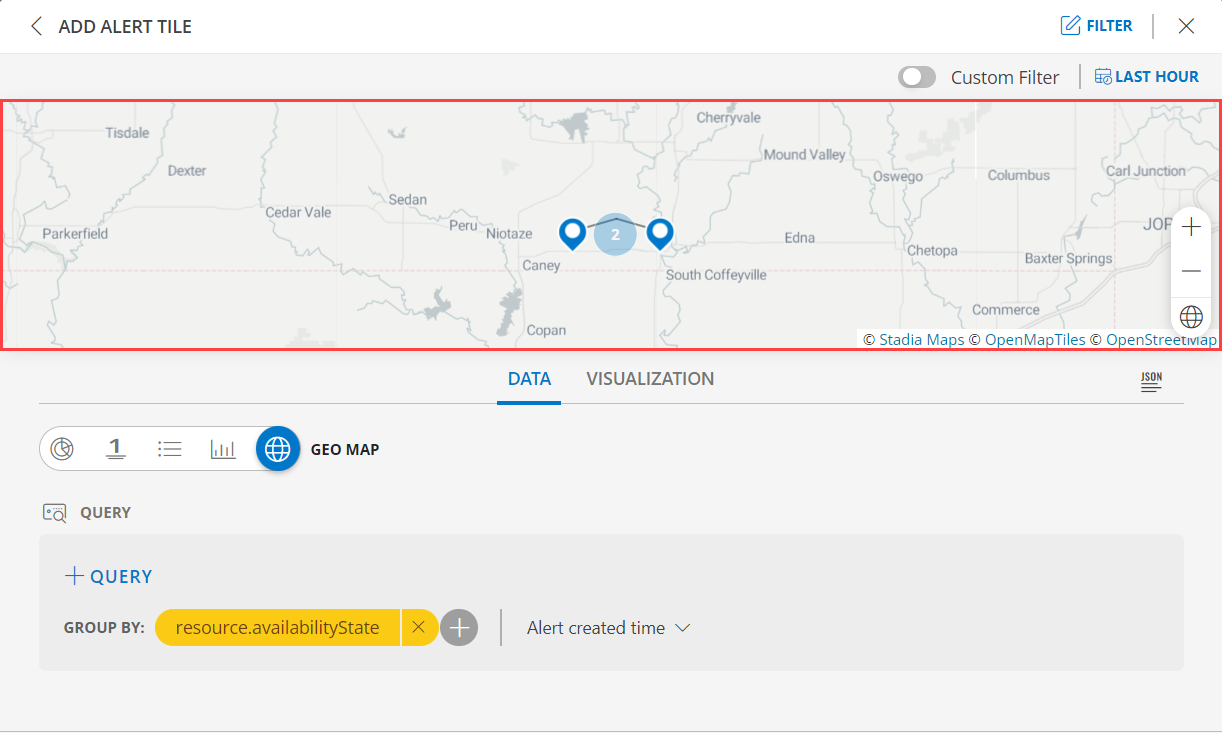
- You can zoom in on the map, by clicking the + icon and zoom out by clicking the - icon on the bottom right corner.
- Click the location to VIEW ALERTS of that location.
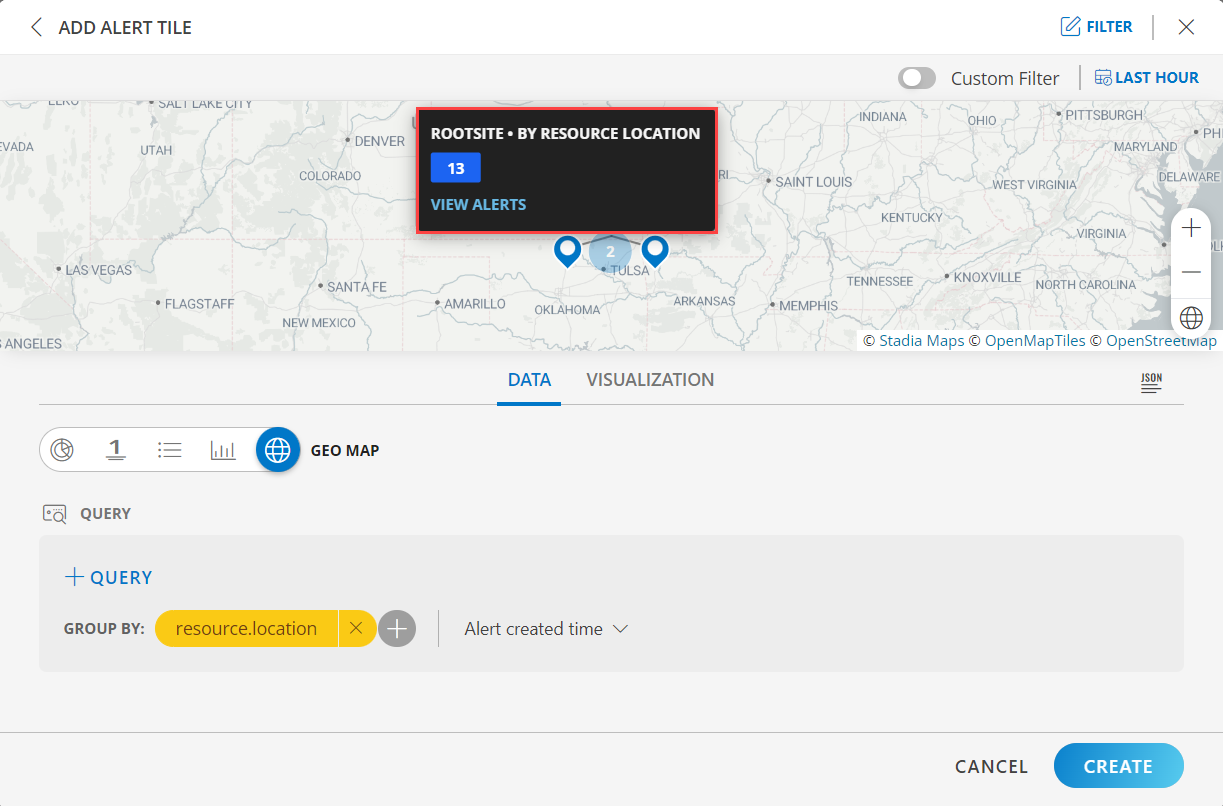
To understand more about the availability of a particular resource in a particular site, let us consider the following example:
- Group By:
resource.availabilityState
- Group By:
The status is displayed as both label (text) and numeric value. The following are the values:
- Unmonitored
- Up
- Down
- Unknown
- Undefined
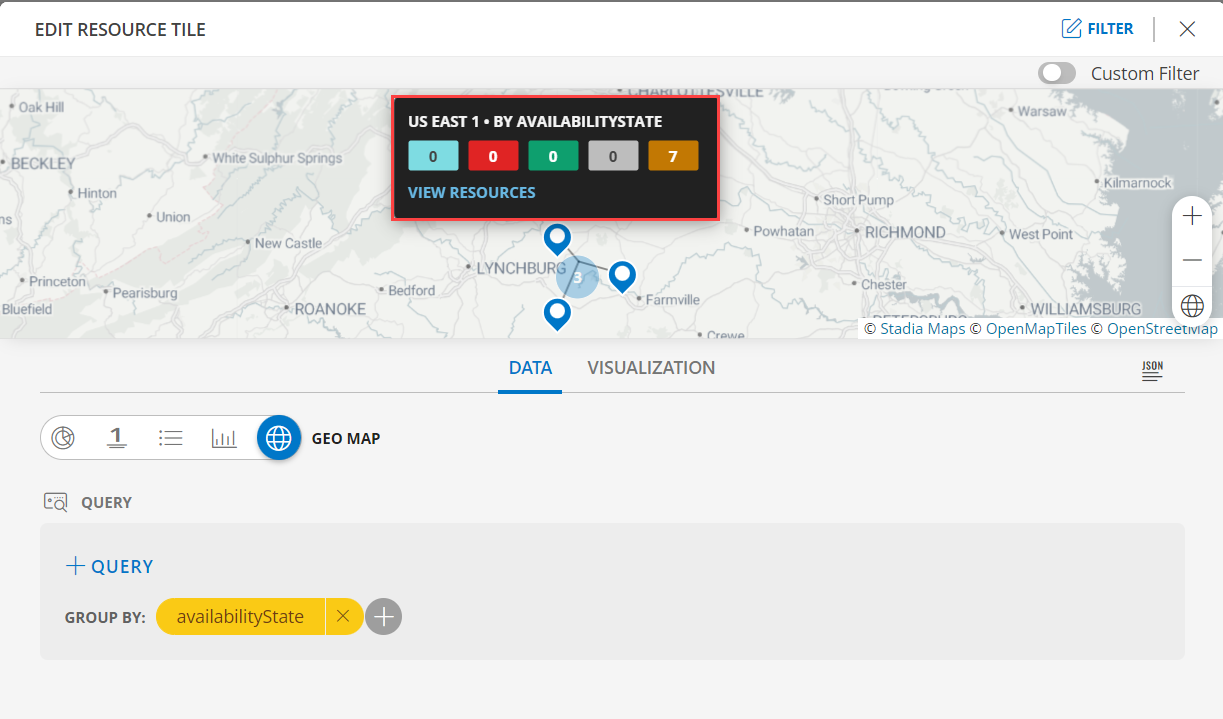
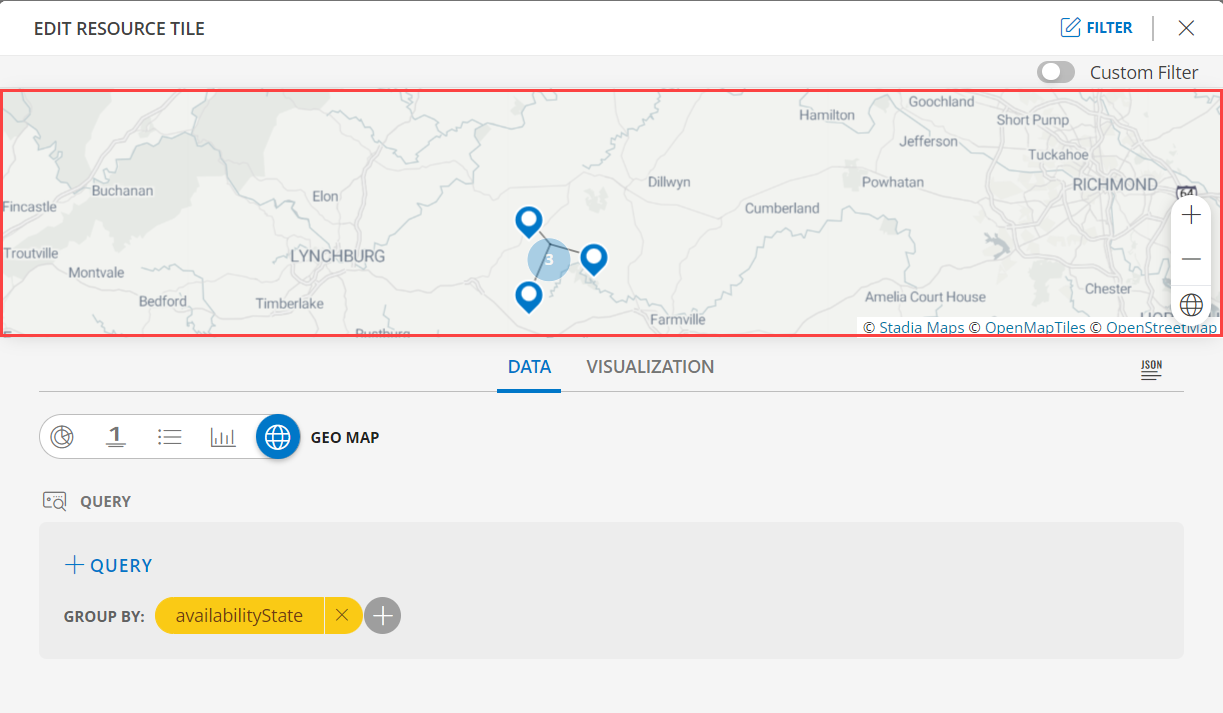
Geomap Visualization for Resource Tile
The following is the visualization with the inputs:
- Group By:
location
Notes:
- You can zoom in on the map, by clicking the + icon and zoom out by clicking the - icon on the bottom right corner.
- Click the location to VIEW RESOURCE of that location.
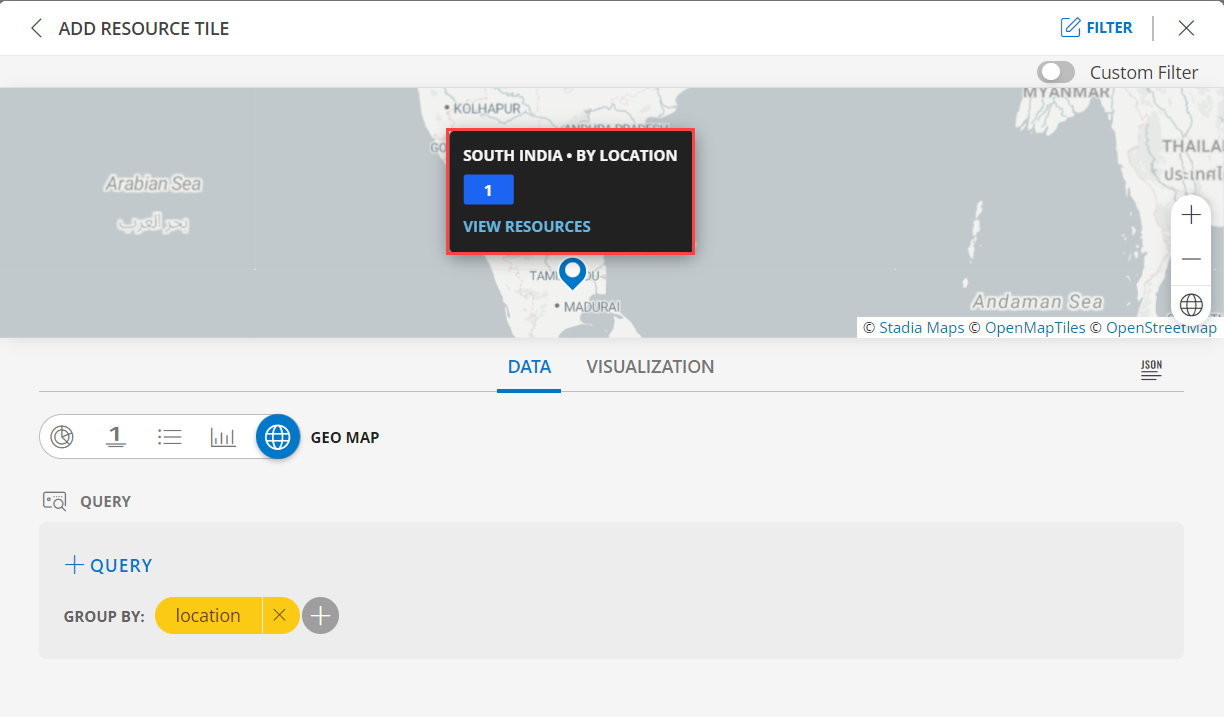
To understand more about the availability of a particular resource in a particular site, let us consider the following example:
- Group By:
availabilityState
- Group By:
The status is displayed as both label (text) and numeric value. The following are the values:
- Unmonitored
- Up
- Down
- Unknown
- Undefined