This section guides you through setting up, configuring, and managing the Proxmox integration in OpsRamp.
Prerequisites
Before configuring the integration, ensure that your environment meets the following requirements related to gateway versions, credentials, and connectivity.
- OpsRamp Classic Gateway (Linux) version 14.2.0 or later.
- OpsRamp NextGen Gateway version 14.2.0 or later.
- Proxmox management IP or FQDN must be reachable from the gateway.
- Proxmox API port 8006 (default) must be open and reachable.
- HTTPS communication must be allowed between gateway and Proxmox endpoint.
- Follow the steps below to create a dedicated API user for the monitoring integration.
- Create a Dedicated User: Create a monitoring user in your Proxmox environment. Set the Realm (authentication backend) explicitly to pve (Proxmox VE authentication server).
- Generate the API Token: Create an API Token for this new user. Ensure that the Privilege Separation checkbox is Checked (Enabled). Copy the 36-character secret key immediately.
- Assign the Role & Path: Add an API Token Permission. Set the Path to
/(the root path, giving visibility to the whole cluster) and assign the PVEAuditor role to your newly created token. - Configure the Integration UI: Enter the generated token details into our integration interface using the following mapping:
- Username / API Token ID:
monitoring-agent@pve!monitoring-gateway - Password / API Token Secret:
[Your-36-Character-Secret-UUID]
- Username / API Token ID:
Configure Proxmox Integration
To configure the integration:
- From All Clients, select a client.
- Navigate to Setup > Account.
- Select the Integrations tab.
- The Installed Integrations page, where all the installed integrations are displayed. Click + ADD on the Installed Integrations page.
- If you do not have any installed applications, you will be navigated to the Available Integrations page. The Available Integrations page displays all the available applications along with the newly created application with the version.
Note: Search for the application using the search option available. Alternatively, use the All Categories option to search. - Click ADD on the Proxmox tile.
- From the Configurations page, click + ADD. The Add Configuration page appears.
- Enter the following BASIC INFORMATION:

| Field Name | Description | Field Type | Default Value |
|---|---|---|---|
| Name | A user-defined display name for the integration instance. | String | |
| Proxmox IpAddress/Hostname | Enter the management IP address or hostname of the Proxmox. You must be able to connect to this using HTTPS. This is the primary endpoint for all REST API. | String | |
| Is Secure | Select this checkbox if you want the communication between your system and the specified endpoint to be secured using HTTPS (HTTP over SSL/TLS). Default Selection: When selected, it signifies that the connection is encrypted, providing an added layer of security to the data being transmitted. | Checkbox | true |
| API Port | Provide the API Port details. The port must be open and accessible for API communication from the gateway. This port is used for both discovery REST APIs (Kubernetes-style) and Prometheus monitoring queries. Note: By default API Port is 443. | String | 8006 |
| credentials | Select the Credential from the drop-down list. (Optional): Click + Add to create a credential. The ADD CREDENTIAL window is displayed. Enter the following information.
| Dropdown | |
| App Failure Notifications | Enable or disable application failure notification alerts. When enabled, OpsRamp generates alerts if the integration encounters connectivity or authentication failures during discovery or monitoring operations. | Checkbox | false |
Notes:
- By default the Is Secure checkbox is selected.
- IP Address and Port should be accessible from Gateway.
- Select the following:
- App Failure Notifications: if turned on, you will be notified in case of an application failure that is, Connectivity Exception, Authentication Exception.
- Select the following Custom Attribute:
| Functionality | Description |
|---|---|
| Custom Attribute | Select the custom attribute from the drop down list. |
| Value | Select the value from the drop down list. |
Note: The custom attribute that you add here will be assigned to all the resources that are created by the integration. You can add a maximum of five custom attributes (key and value pair).
- In the Native Types section, select the native types to be discovered.
- In the DISCOVERY SCHEDULE section, select Recurrence Pattern to add one of the following patterns:
- Minutes
- Hourly
- Daily
- Weekly
- Monthly
- Click ADD.
The configuration is saved and displayed on the configurations page after you save it.
Note: From the same page, you may Edit and Remove the created configuration.
- Under the ADVANCED SETTINGS, Select the Bypass Resource Reconciliation option, if you wish to bypass resource reconciliation when encountering the same resources discovered by multiple applications. Note: If two different applications provide identical discovery attributes, two separate resources will be generated with those respective attributes from the individual discoveries.
- Click NEXT.
- (Optional) Click +ADD to create a new collector. You can either use the pre-populated name or give the name to your collector.
- Select an existing registered profile.
- Click FINISH.
The integration is installed and displayed on the INSTALLED INTEGRATION page. Use the search field to find the installed integration.
Modify the Configuration
- See Modify an Installed Integration or Application article.
Note: Select Proxmox.
View the Proxmox Details
To discover resources for Proxmox:
- Navigate to Infrastructure > Search > Virtualization > Proxmox. The Proxmox page is displayed.
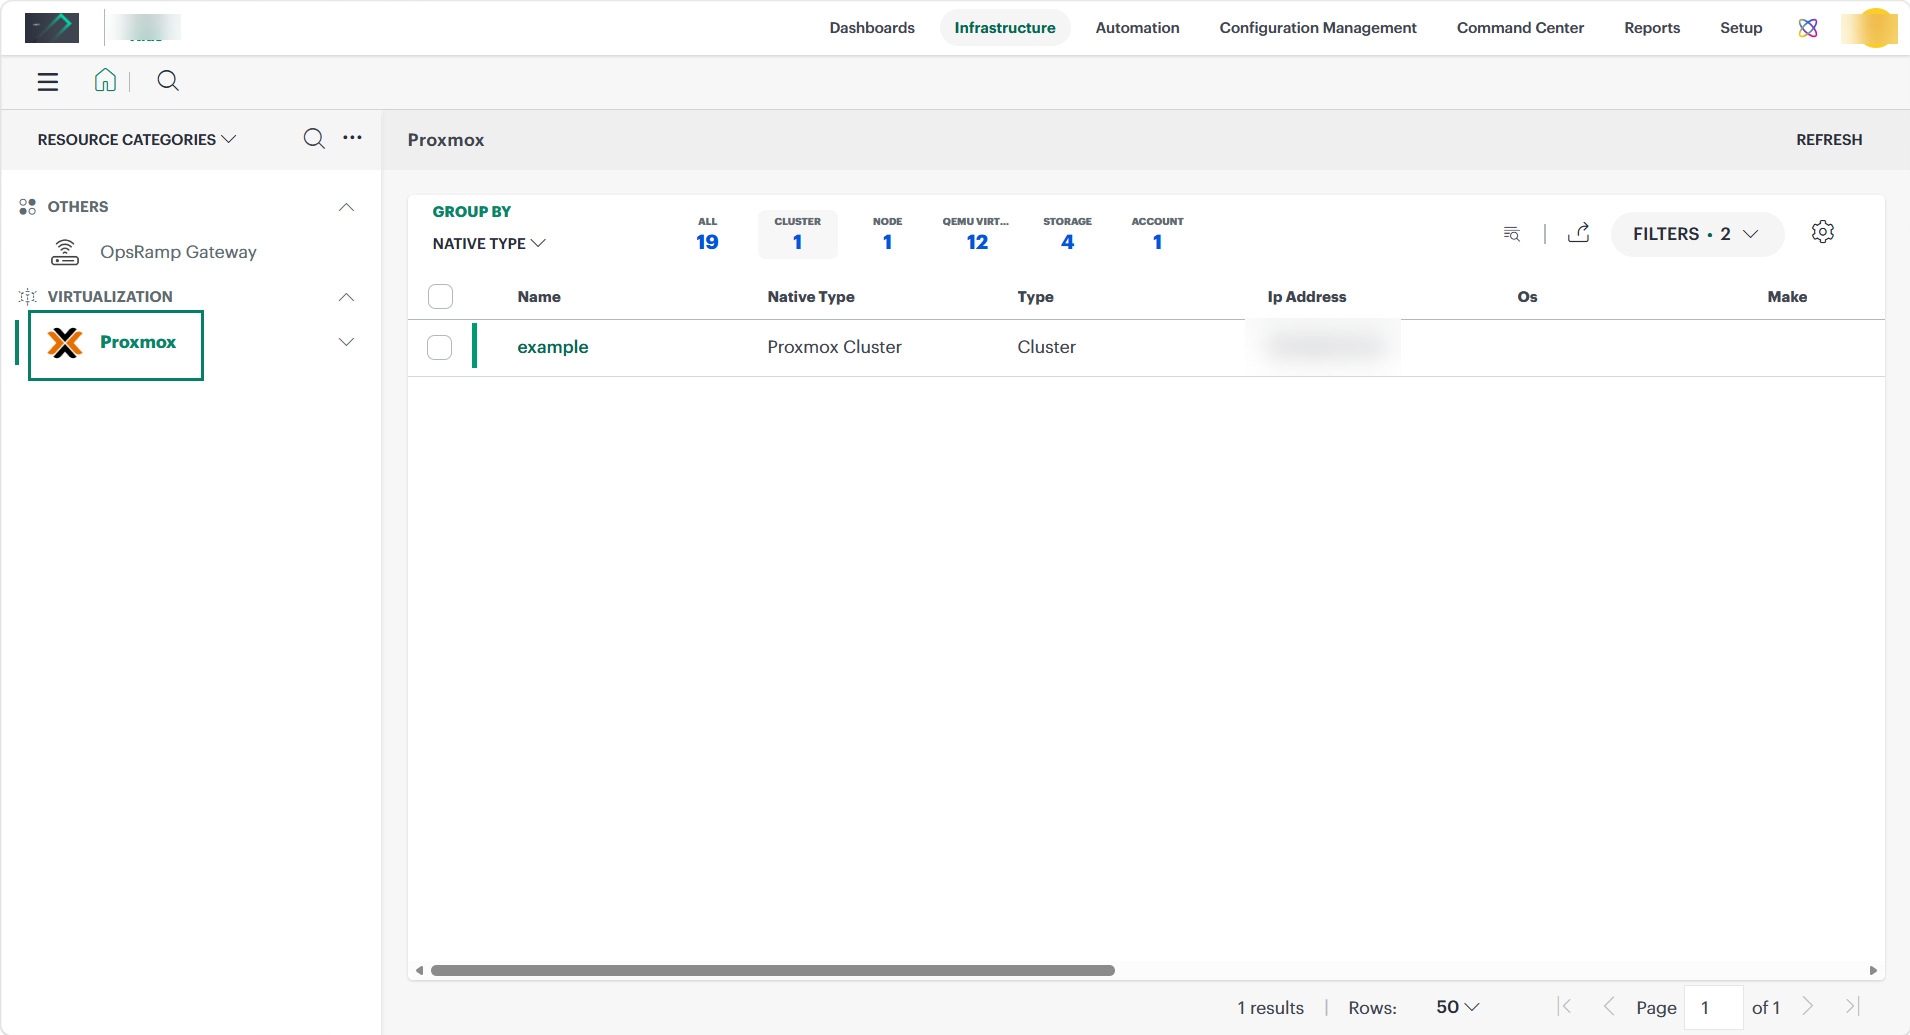
- Select the application on the Proxmox page.
- The RESOURCE page appears from the right.
- Click the ellipsis (…) on the top right and select View Details.
- Navigate to the Attributes tab to view the discovery details.
- Click the Metrics tab to view the metric details for Proxmox.
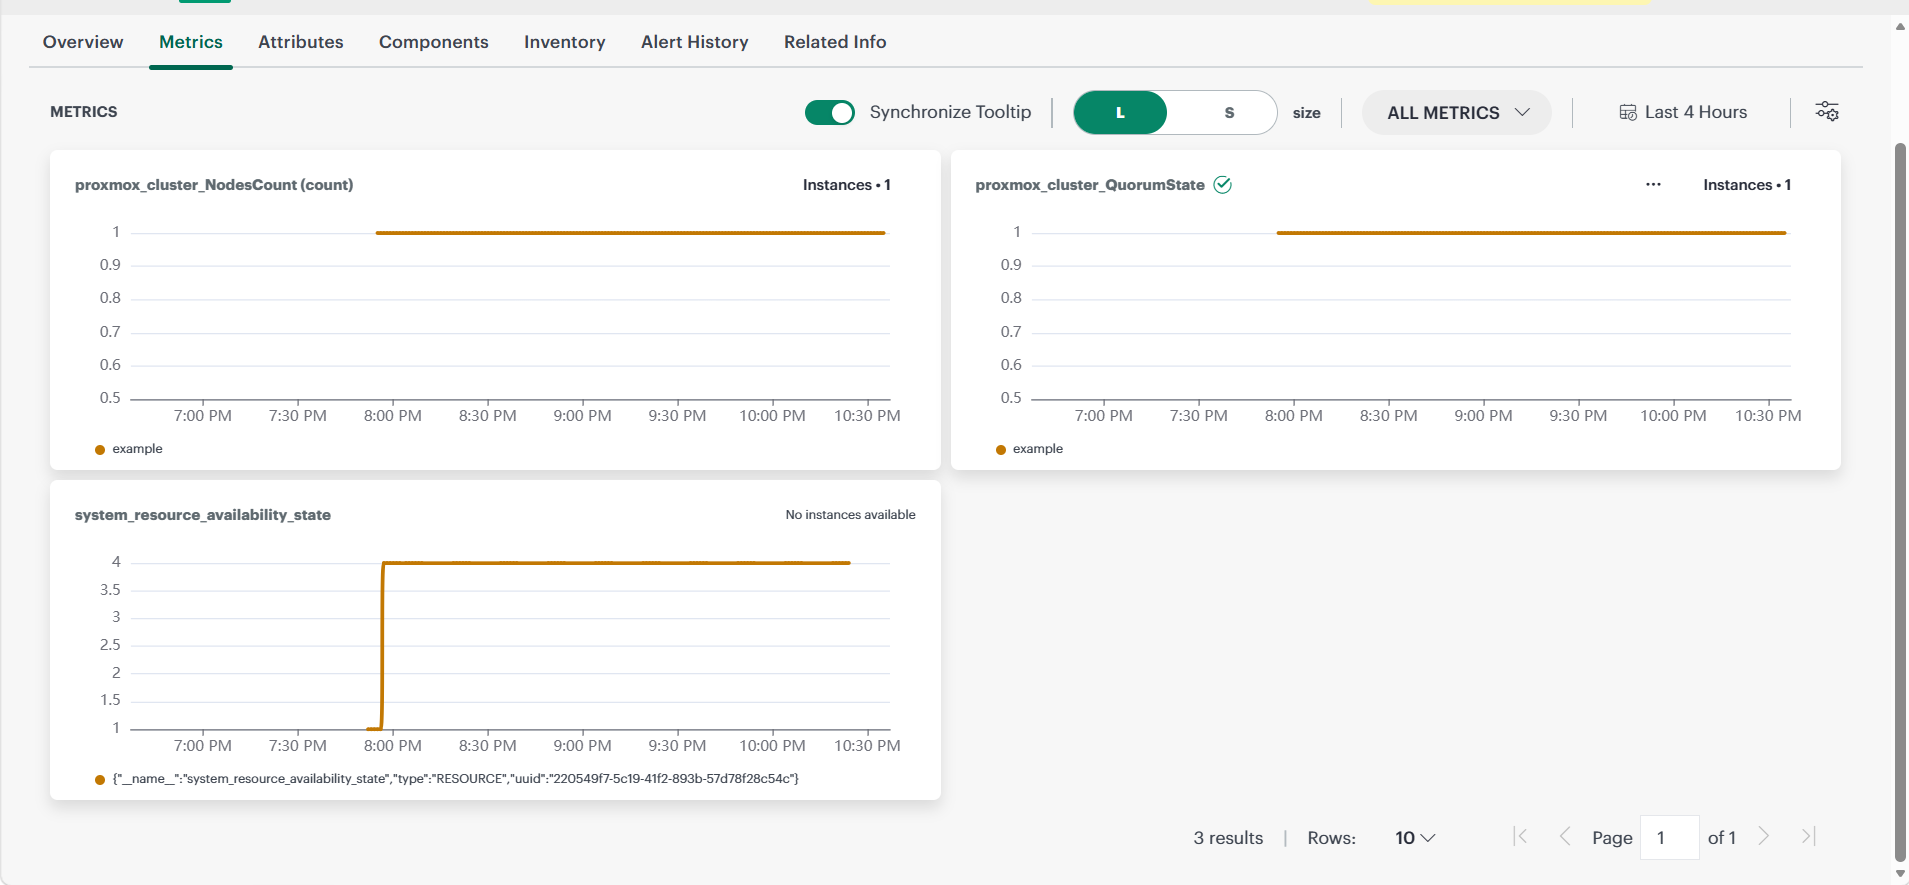
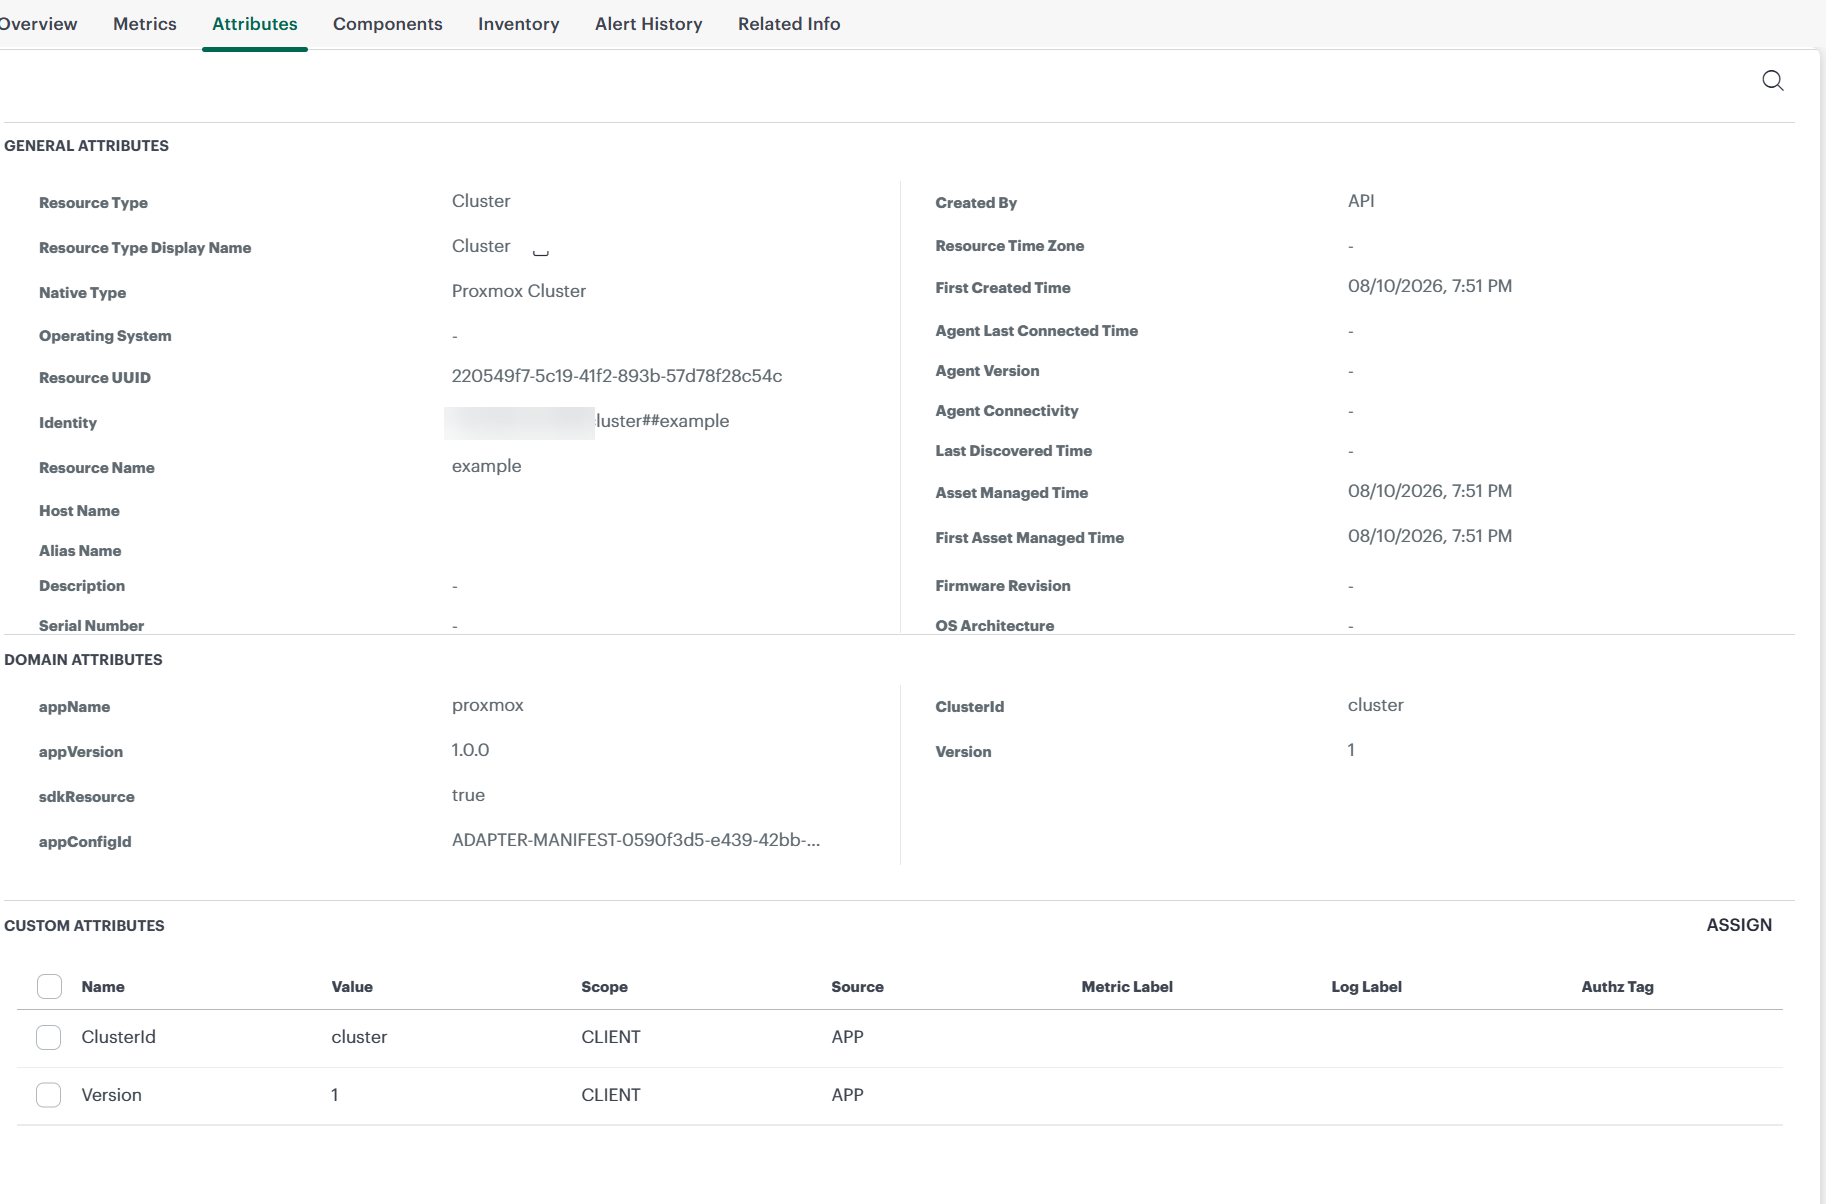
View resource metrics
To confirm Proxmox monitoring, review the following:
- Metric graphs: A graph is plotted for each metric that is enabled in the configuration.
- Alerts: Alerts are generated for metrics that are configured as defined for integration.