Introduction
Network Performance Monitoring (NPM) is a critical network management technique involving real-time tracking and analysis of network traffic patterns. It provides valuable insights into data flow, helping organizations optimize network efficiency, detect anomalies, and enhance security by monitoring the flow of data packets within their networks.
Configure and install the integration
Follow these steps to configure and install the NPM Collector integration.
- From All Clients, select a client.
- Go to Setup > Account.
- Select the Integrations tab.
- The Installed Integrations page, where all the installed applications are displayed.
Note: If there are no installed applications, it will navigate to the Available Integrations page. - Click + ADD on the Installed Integrations page. The Available Integrations page displays all the available applications along with the newly created application with the version.
Note: You can also search for the NPM Collector application using the search option available. Also you can use the All Categories option to search.

- Click ADD on the NPM Collector app tile, and select the desired version (if available). The Add NPM-Collector page is displayed with the Configuration and Installation tabs.
- Click ADD from the Configurations tab.
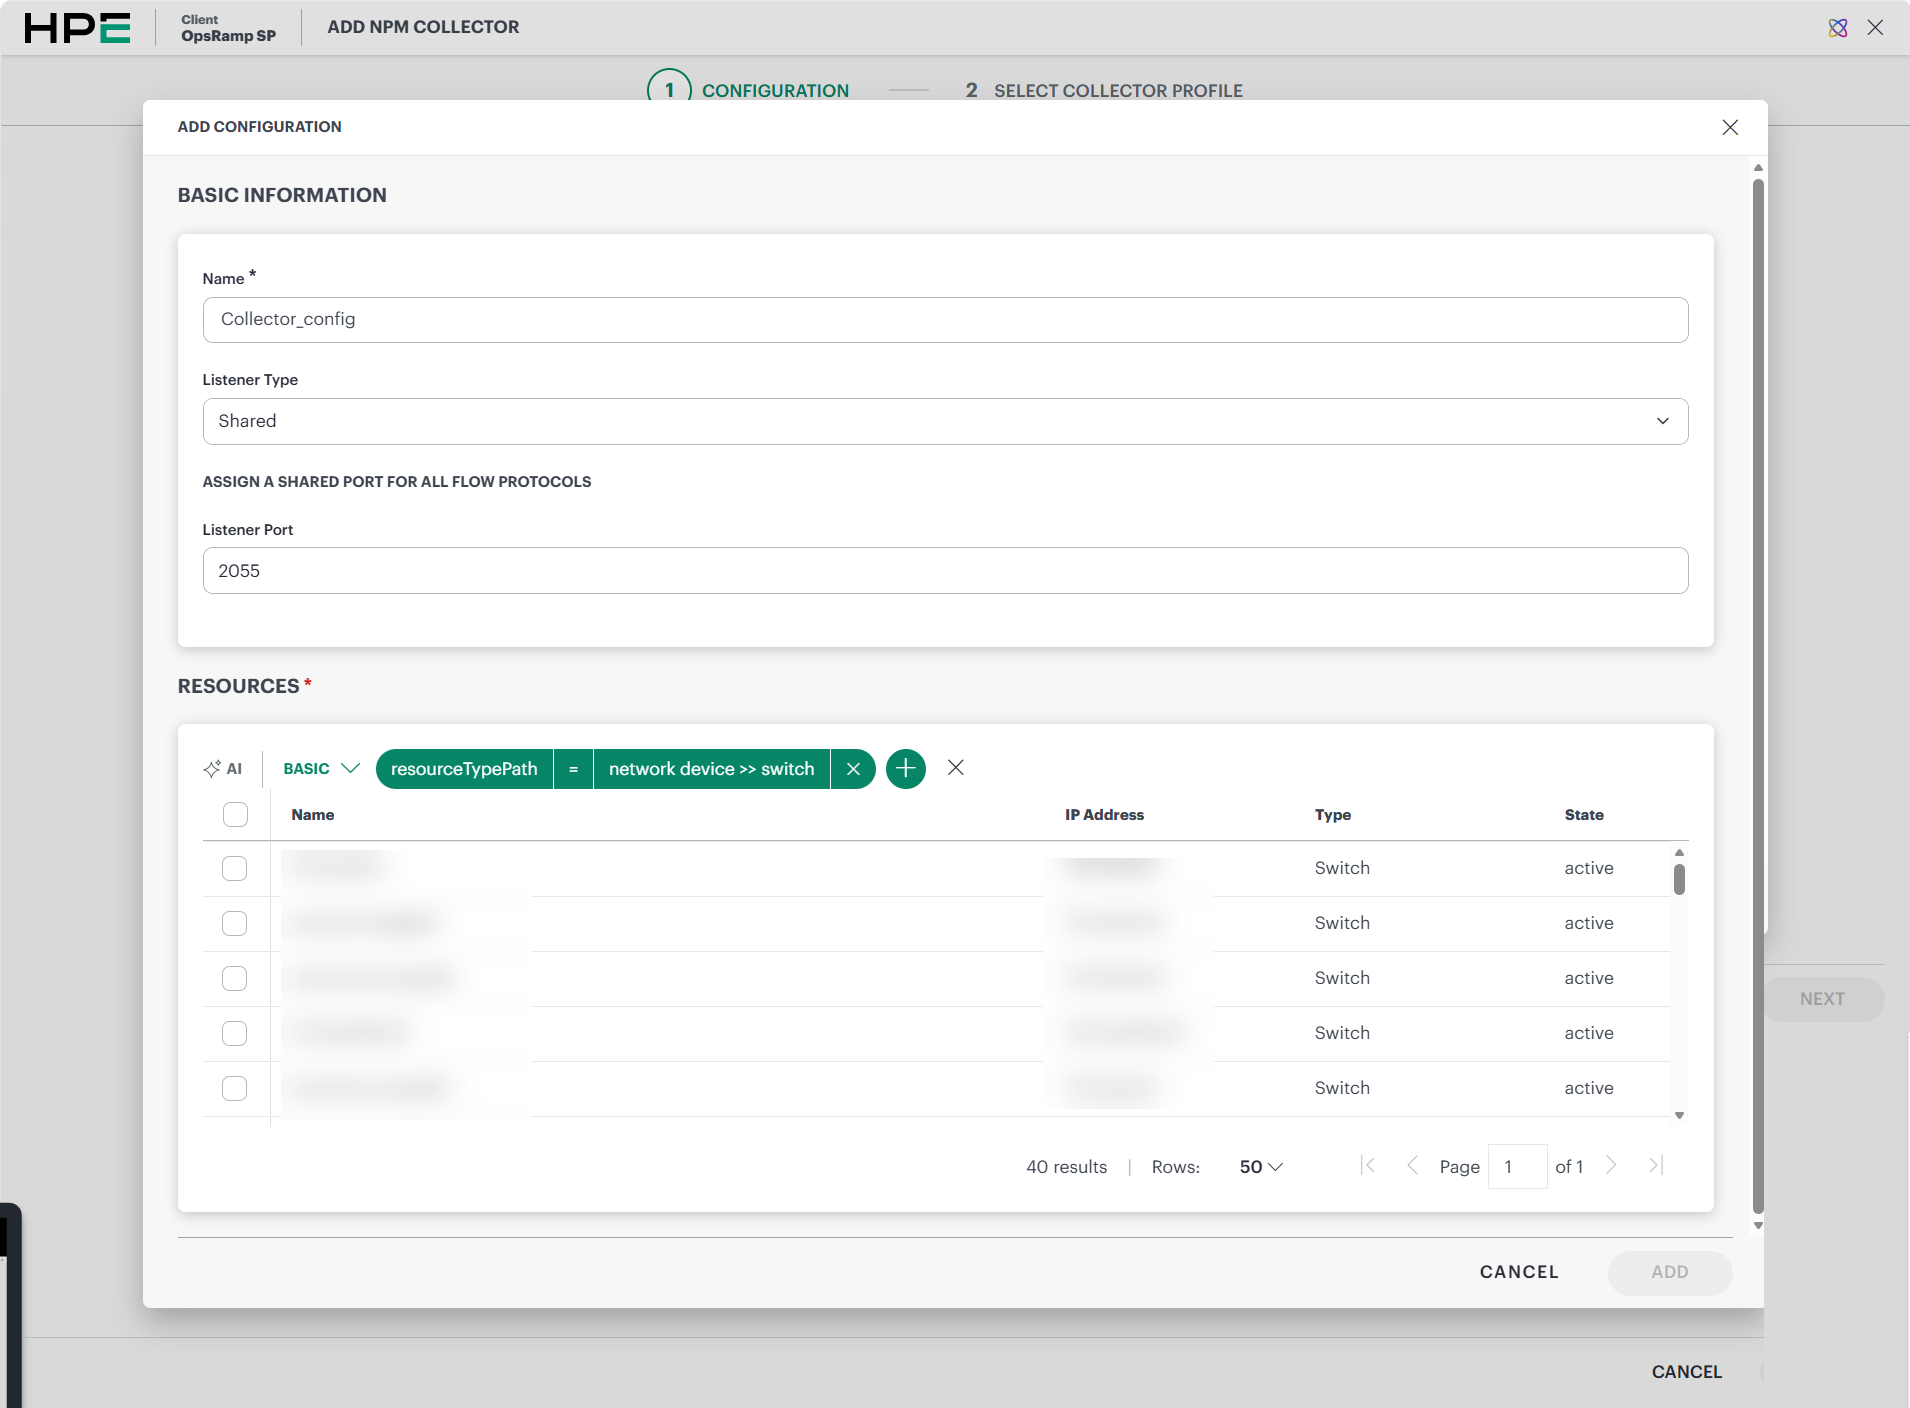
- Enter the below information in the Add Configuration form:
| Field | Description |
|---|---|
| Name | Enter the name for the configuration. |
| Listener Type | Select the Listerner Type for receiving flow data. Two types of listeners are supported:
|
| Listener Port | Specifies the port used by the collector to receive flow data. The default port is 2055. |
| Resources | Resources refer to network devices such as routers, switches, or firewalls that send flow data to the NPM collector. These devices are also known as flow exporters or whitelisted resources. Only whitelisted resources are authorized to act as flow exporters and transmit flow data to the collector.Provide the query to fetch the resources. Default query is given . Select at least one resource from the list of resources. For information on how to build a query, see Query Language Reference. |
If you are not using a particular protocol, you can enter the default port or any unused port number of your choice. This will not affect your setup.
Note
- During NPM collector installation, it is recommended to use the port range 30100 - 32000. Otherwise, the Kubernetes cluster configuration must be updated to accept a different range.
- If flows are not being received after configuring either the default port or an available custom port, run the NPM Debugger to diagnose the issue. For troubleshooting port conflicts, refer to Option 2: Update Node Port Range and Restart k3s .
- For more information, see NPM Debugging Guide .
- Click Add.
The configuration is added and displayed on the Configurations tab.
Click Next.
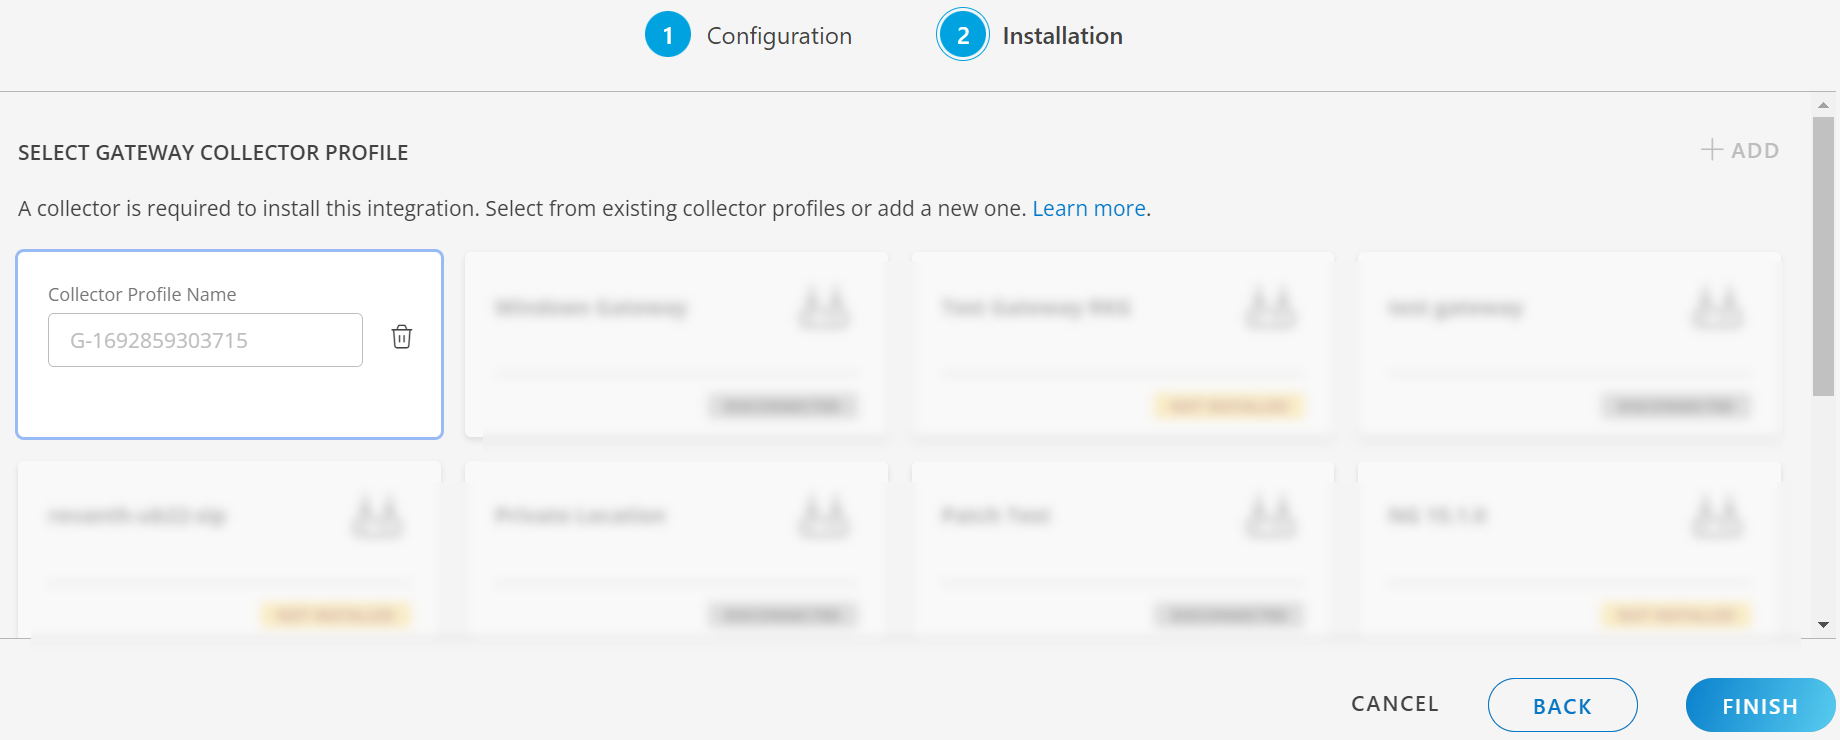
On the Installation tab, click +ADD to create a new collector by providing a name or use the pre-populated name.
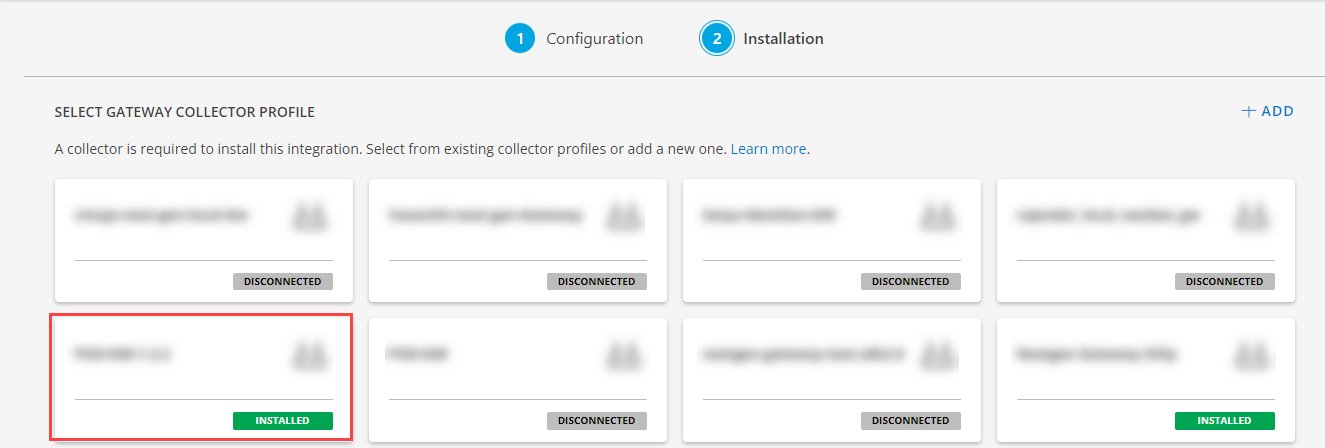
- Or, select an existing registered profile.
On the Edit Gateway Collector Profile page enter or update the gateway collector profile details:
- Profile Name: Specify a unique name for the gateway collector profile.
- Profile Type: Select the required profile type.
- Description: Optionally, provide a description for the profile.
Under Select Gateway Collector, choose the deployment type for the gateway collector. Available options include:
- Amazon Machine Image (AMI)
- Virtual Appliance (ISO)
- Virtual Appliance (OVA)
- Azure Blob Container
- Google Image
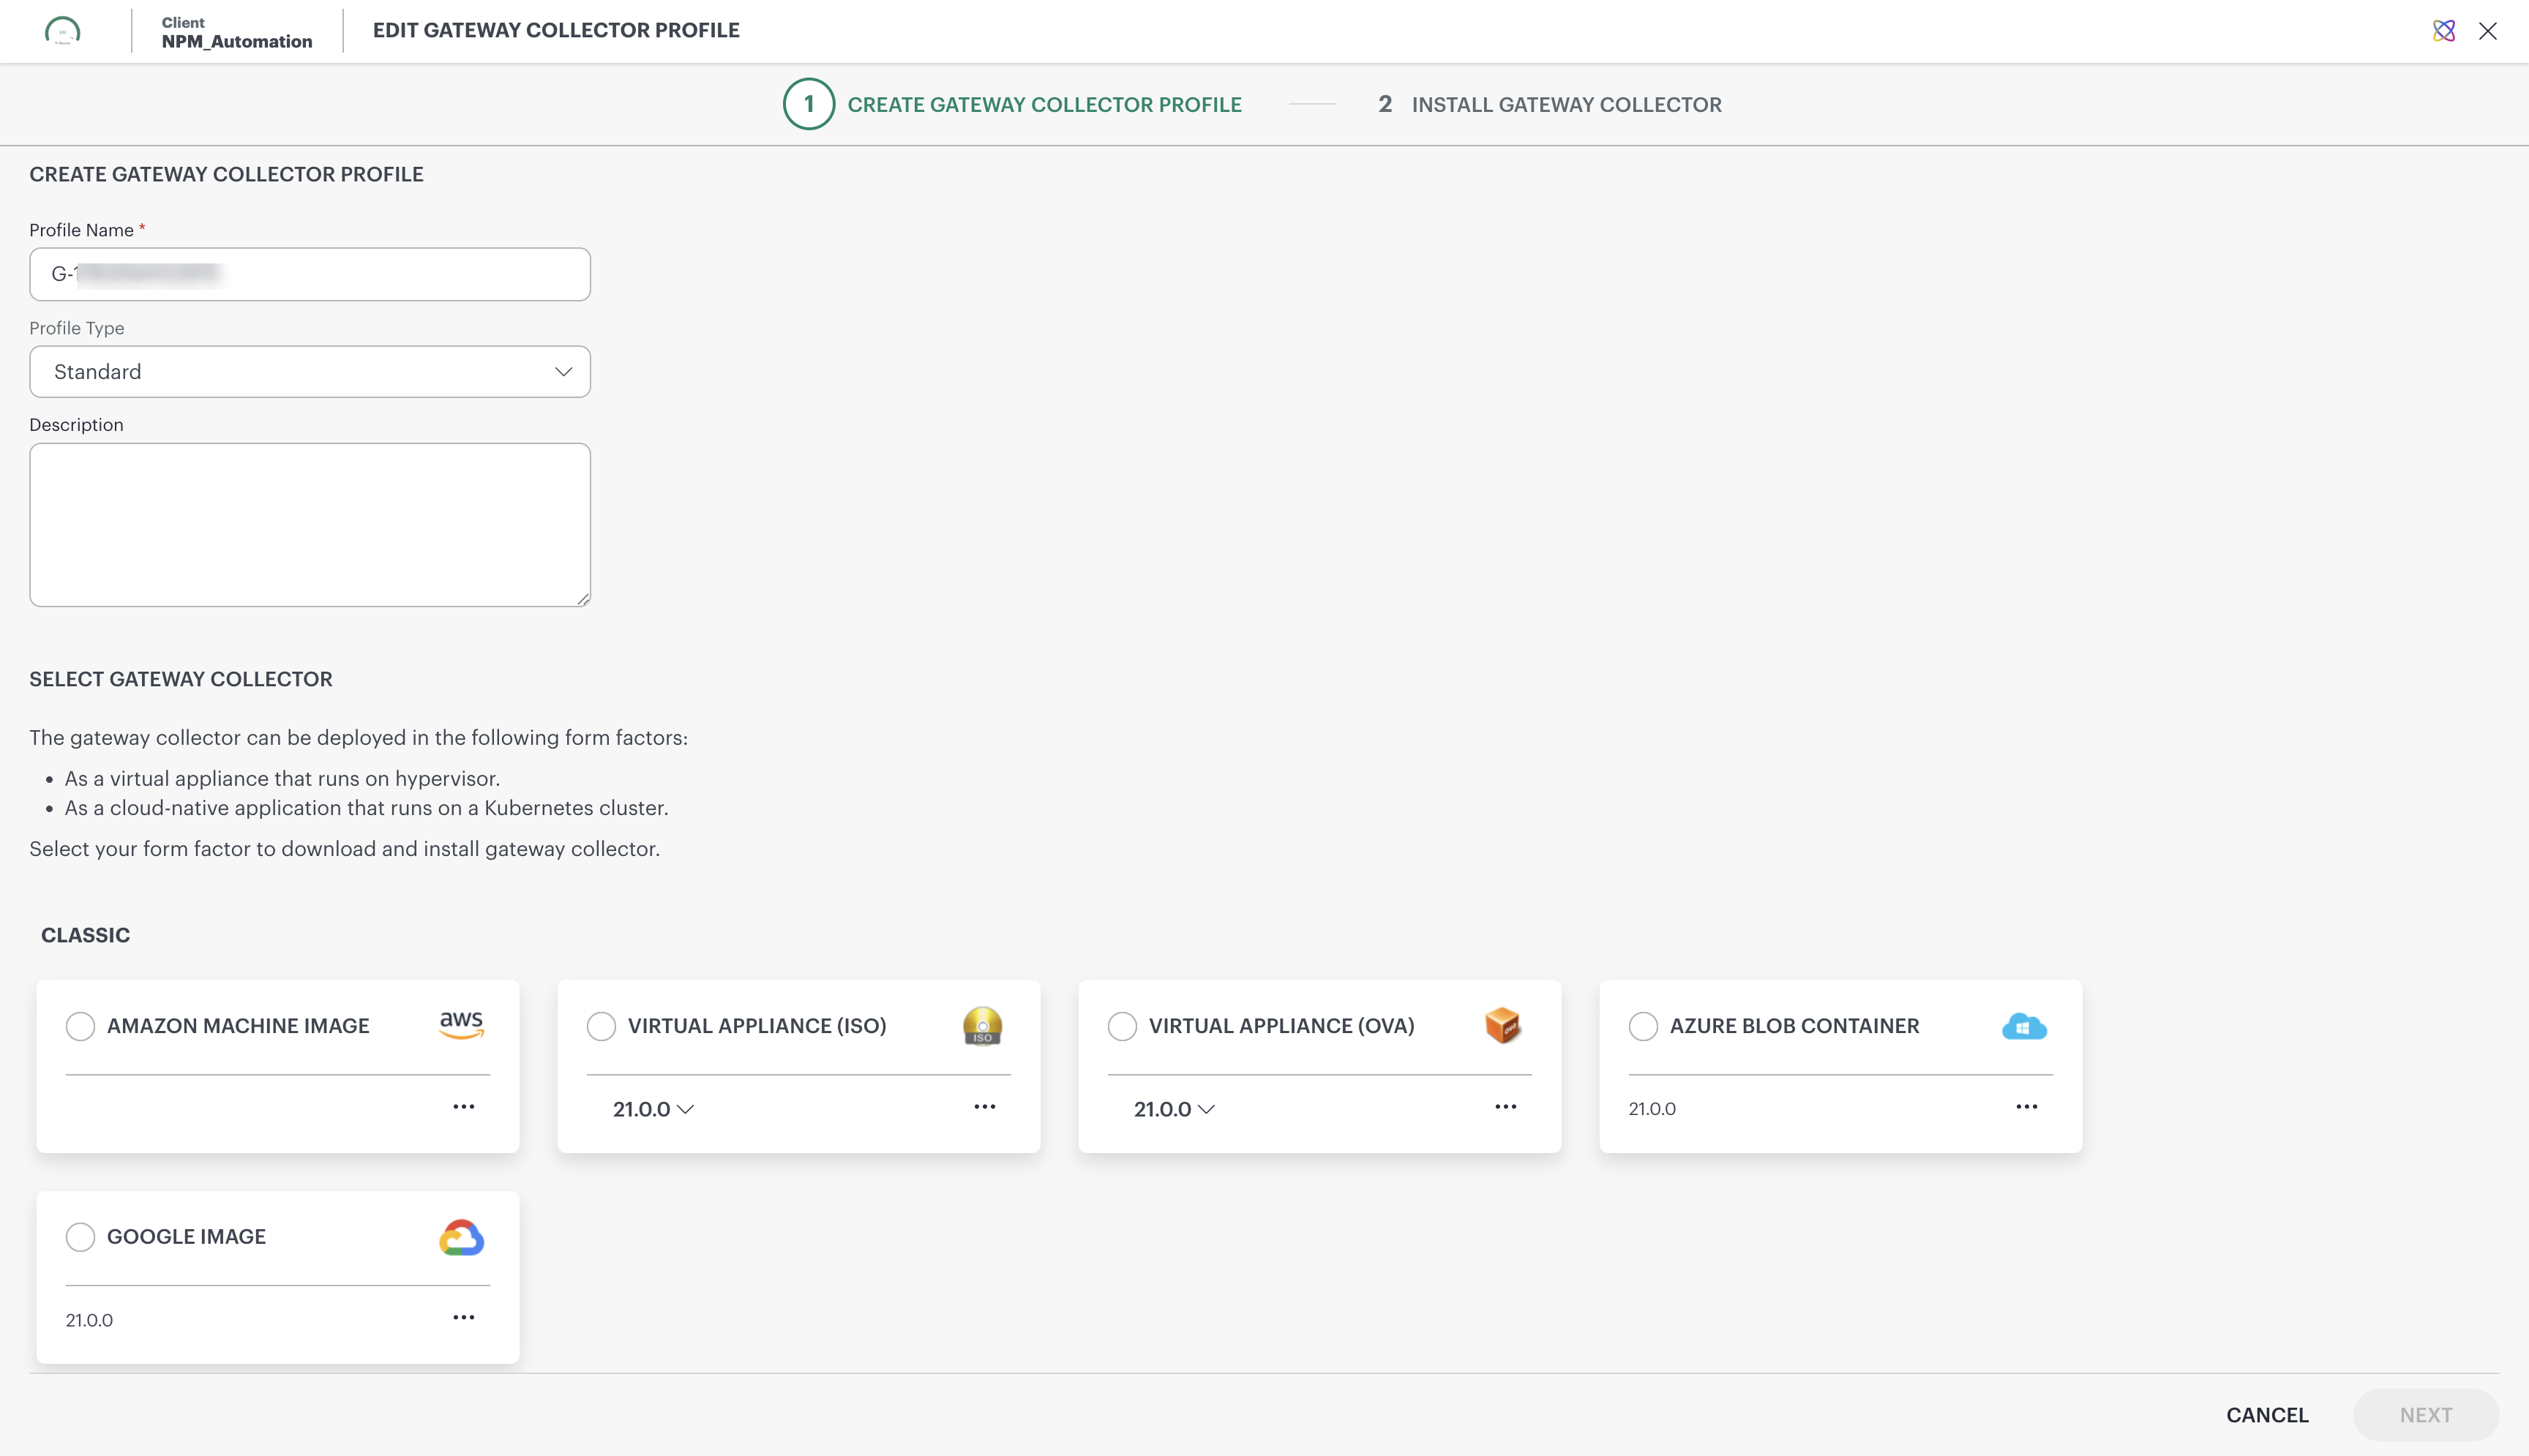
Select the required gateway collector version and click Next.
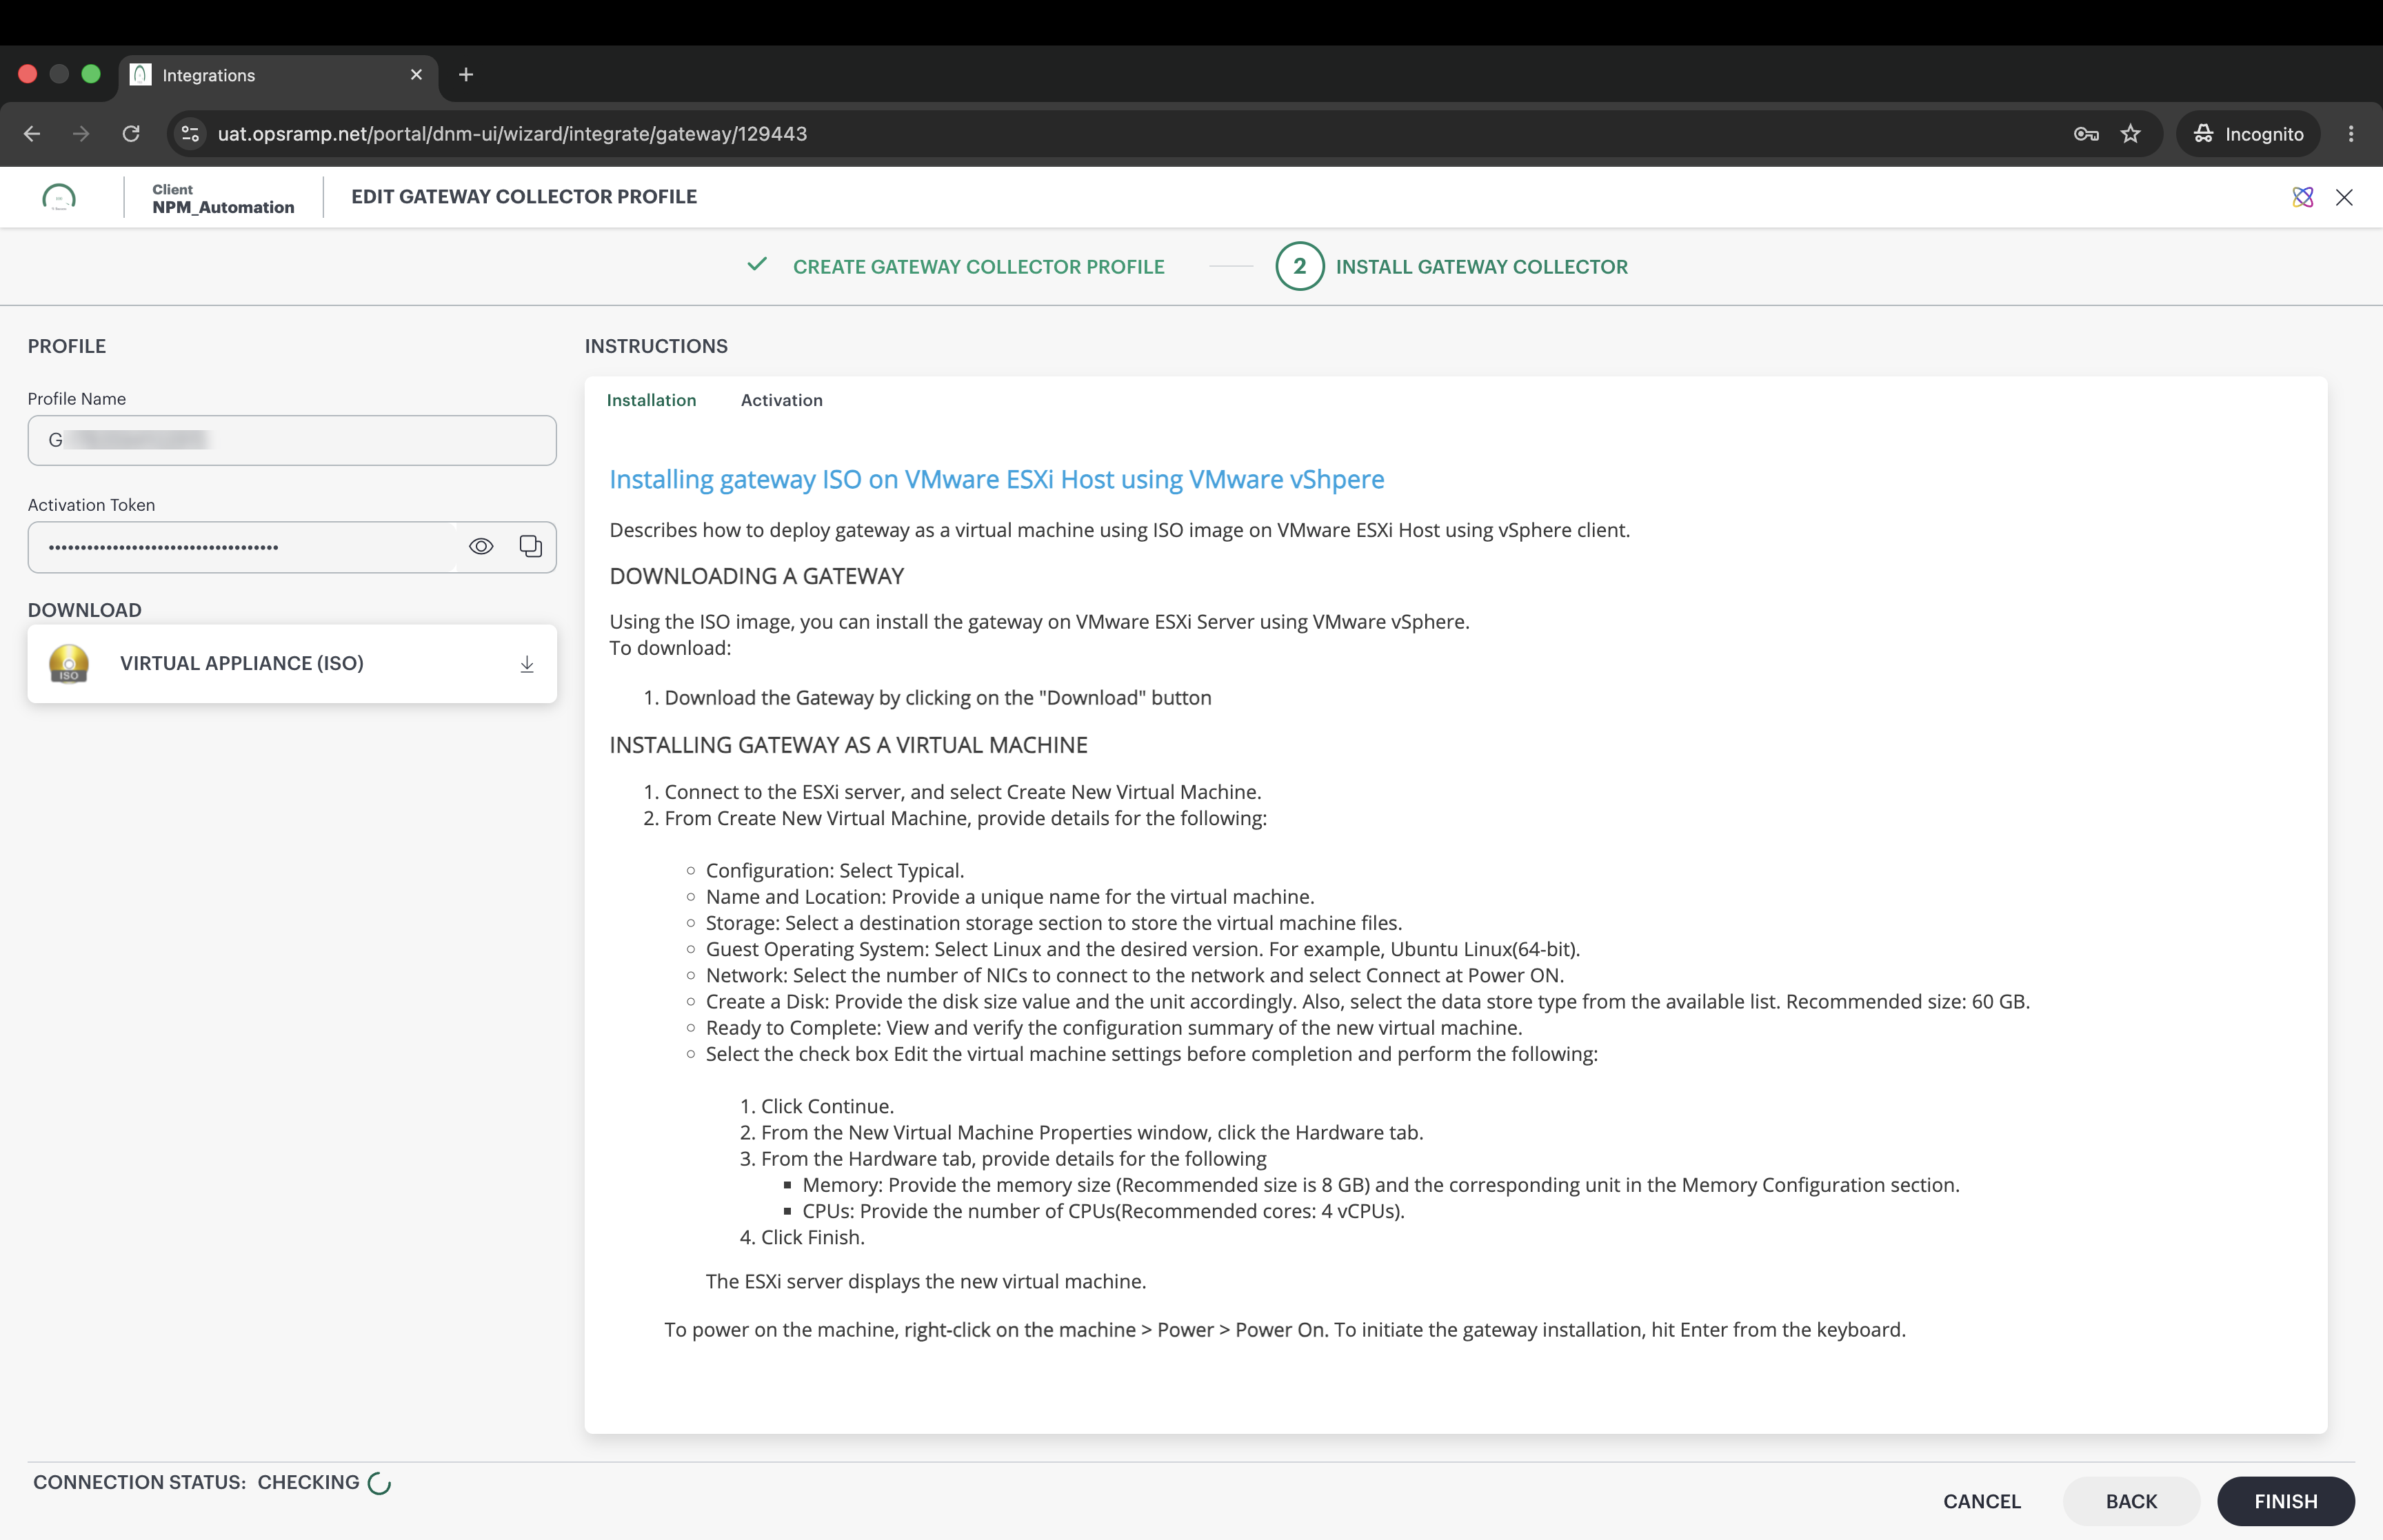
On the Install Gateway Collector page, review the generated Profile Name and Activation Token.
Download the selected gateway collector package and deploy it using the instructions provided in the Installation tab.
After deployment, use the Activation tab instructions to activate the gateway collector.
Verify that the gateway collector is successfully connected and the Connection Status is displayed correctly.
Note
- During the installation of the NextGen Gateway, make sure to enable third-party integration by using the flag
-t enable. - During the installation of the NextGen Gateway, ensure that you enable third-party integration using the
-t enableflag and enable load balancer mode. - To avoid NodePort-related issues (see Problems section), OpsRamp recommends using single load balancer controller mode by default for NPM deployments. The load balancer mode is supported from NPM 2.0.0 version.
- See Available flags for installing nextgen gateway for more details. Refer to the example code below:
opsramp-collector-start install --environment k8s --url {OpsRamp Server URL} --key {Gateway unique authentication token} -t enable -V {current version}
- Ensure that each gateway profile is used only once per configuration.
- You can install the NPM Collector from the NextGen Gateway version 17.2.0 and above.
- Click FINISH.The integration is installed and displayed on the Installed Integrations page.
Edit the configuration
Use the following steps to modify an existing NPM Collector configuration.
Select the NPM Collector integration.
Locate the required configuration in the Configurations list.
Click the More Actions (⋮) menu next to the configuration and select Edit.The Edit Configuration page is displayed.
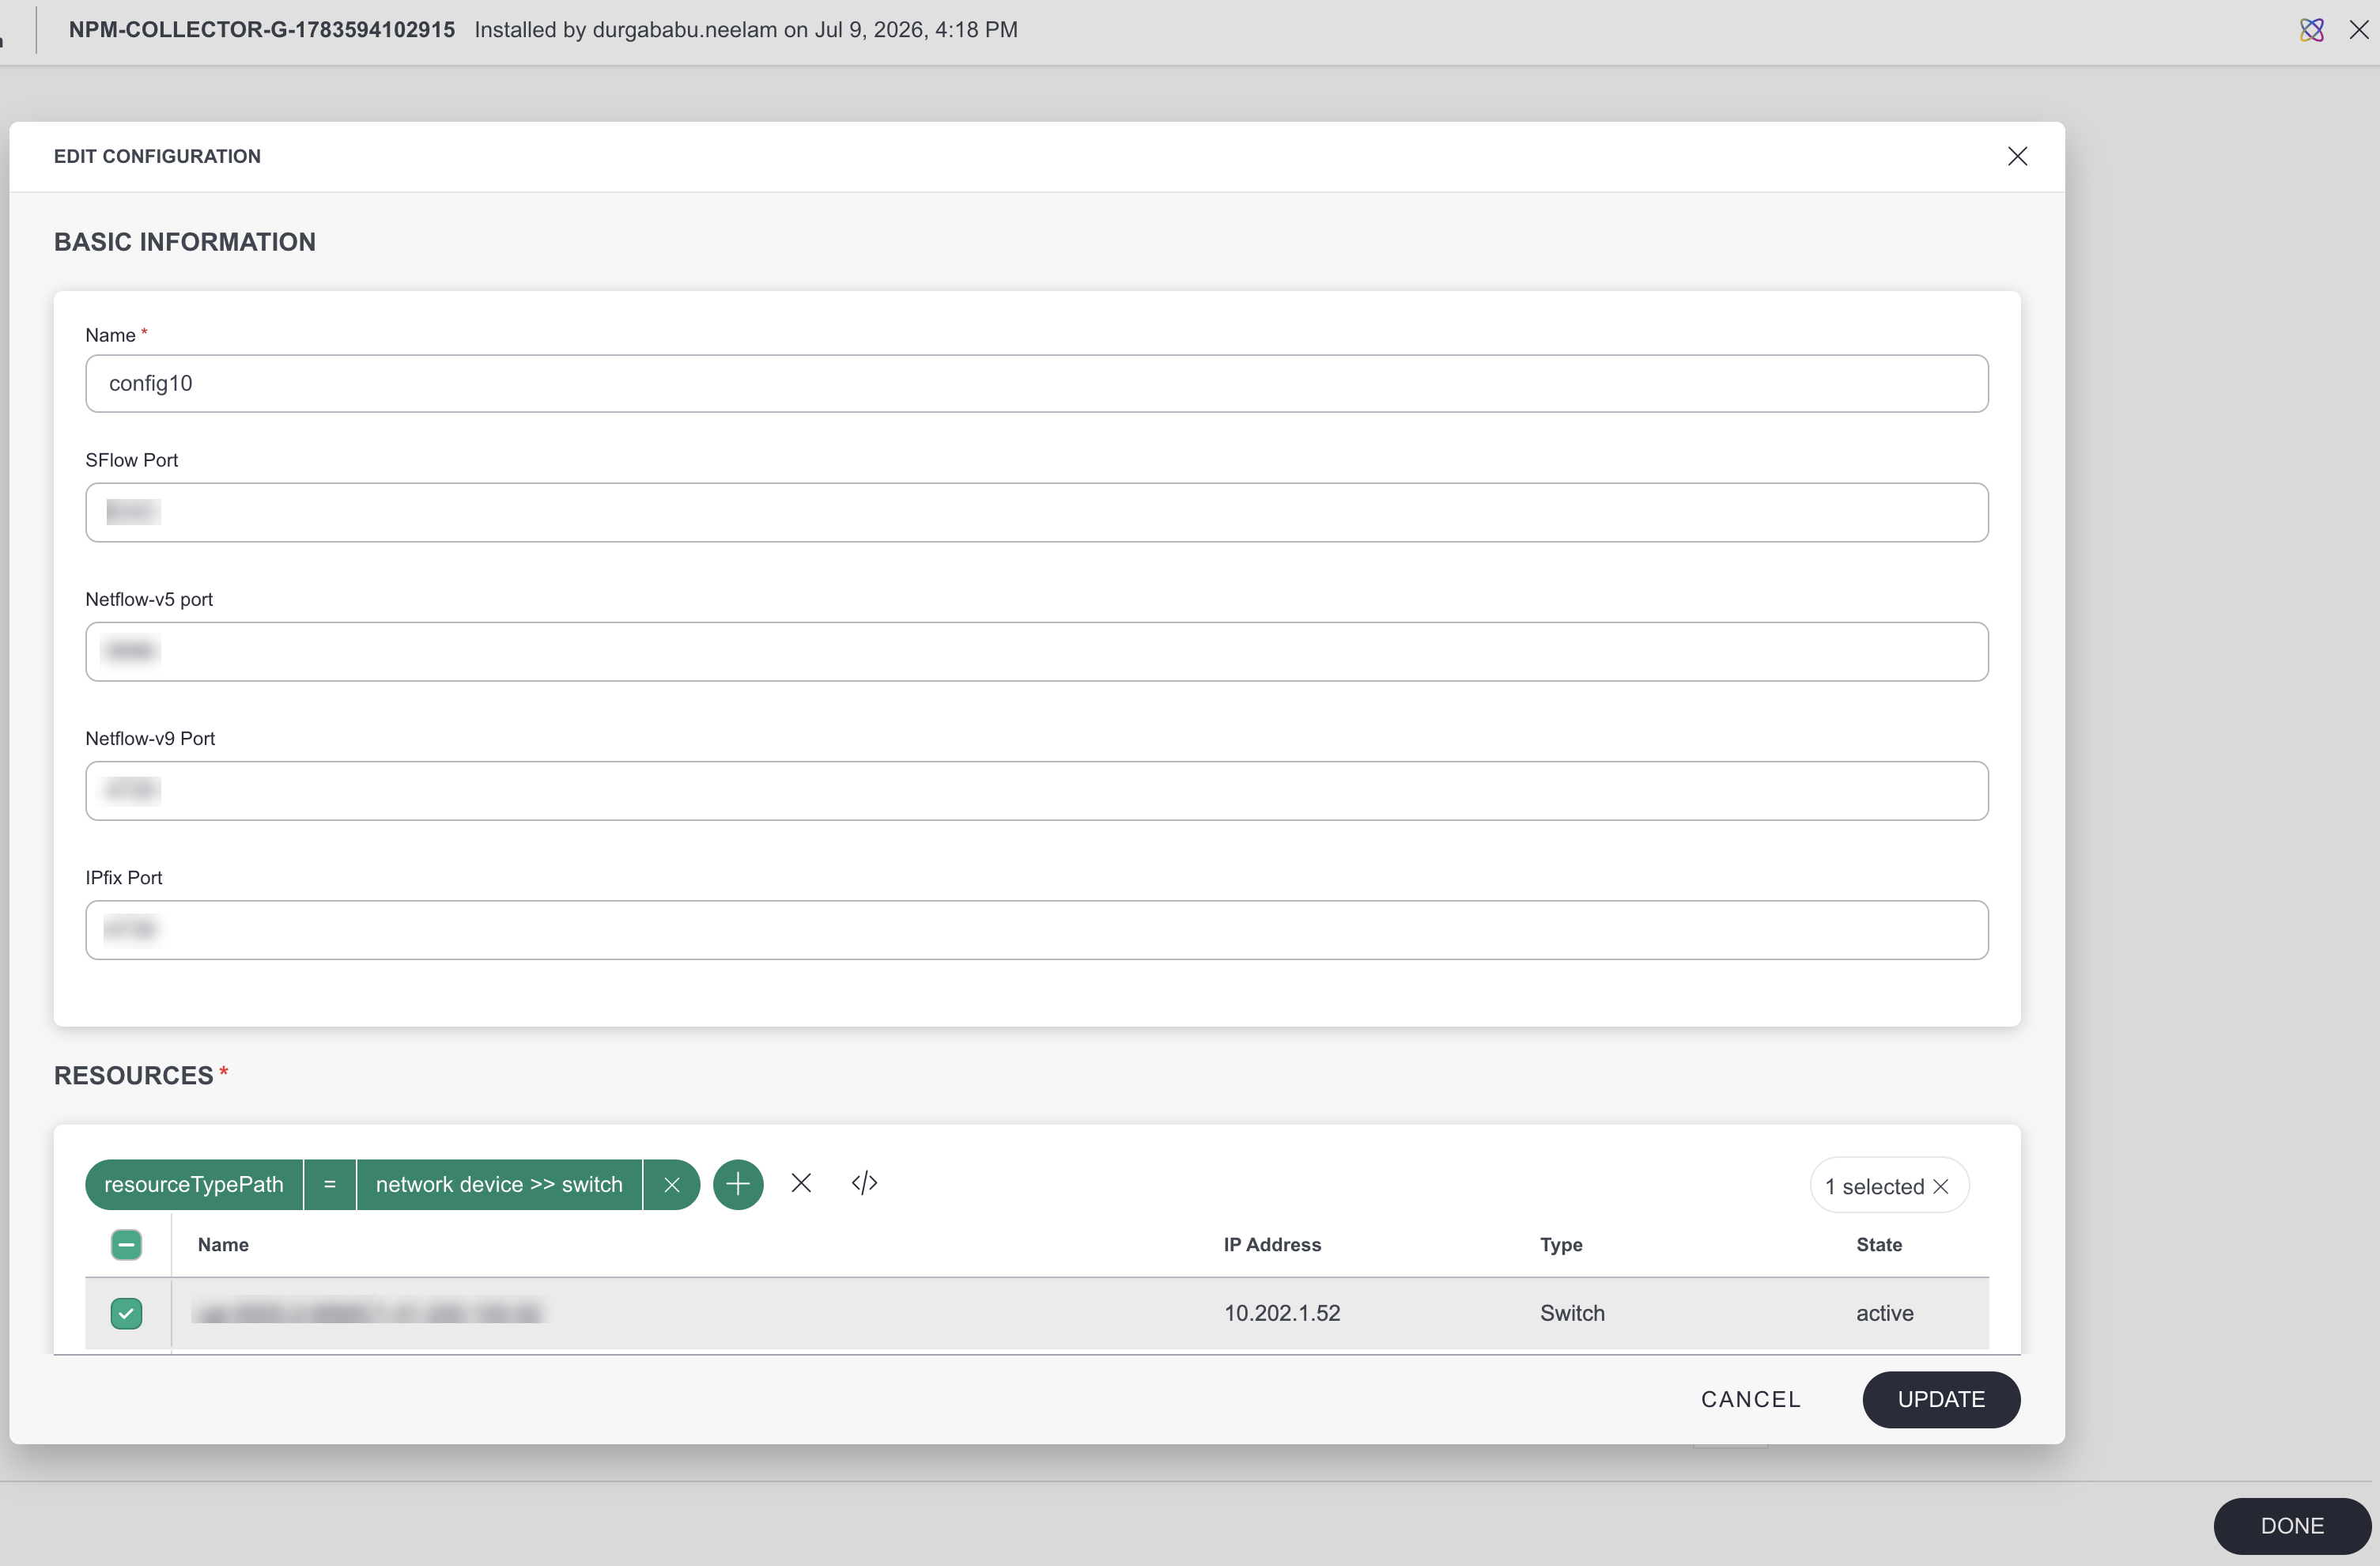
Update the required configuration details under Basic Information:
- Name
- sFlow Port
- NetFlow v5 Port
- NetFlow v9 Port
- IPFIX Port
Under Resources, review the currently selected resources and modify the resource selection as required:
- Add resources using the resource filter.
- Remove resources that are no longer required.
- Verify the selected resources before saving the configuration.
- Click Update to save the changes.The updated configuration is applied, and the NPM Collector begins using the new settings.
Actions on the installed application
- See Modify an Installed Integration or Application on various actions that you can perform on an integration/configuration.
NPM Dashboard Navigation
To access the NPM dashboard:
- Navigate to Infrastructure > Net Flows.
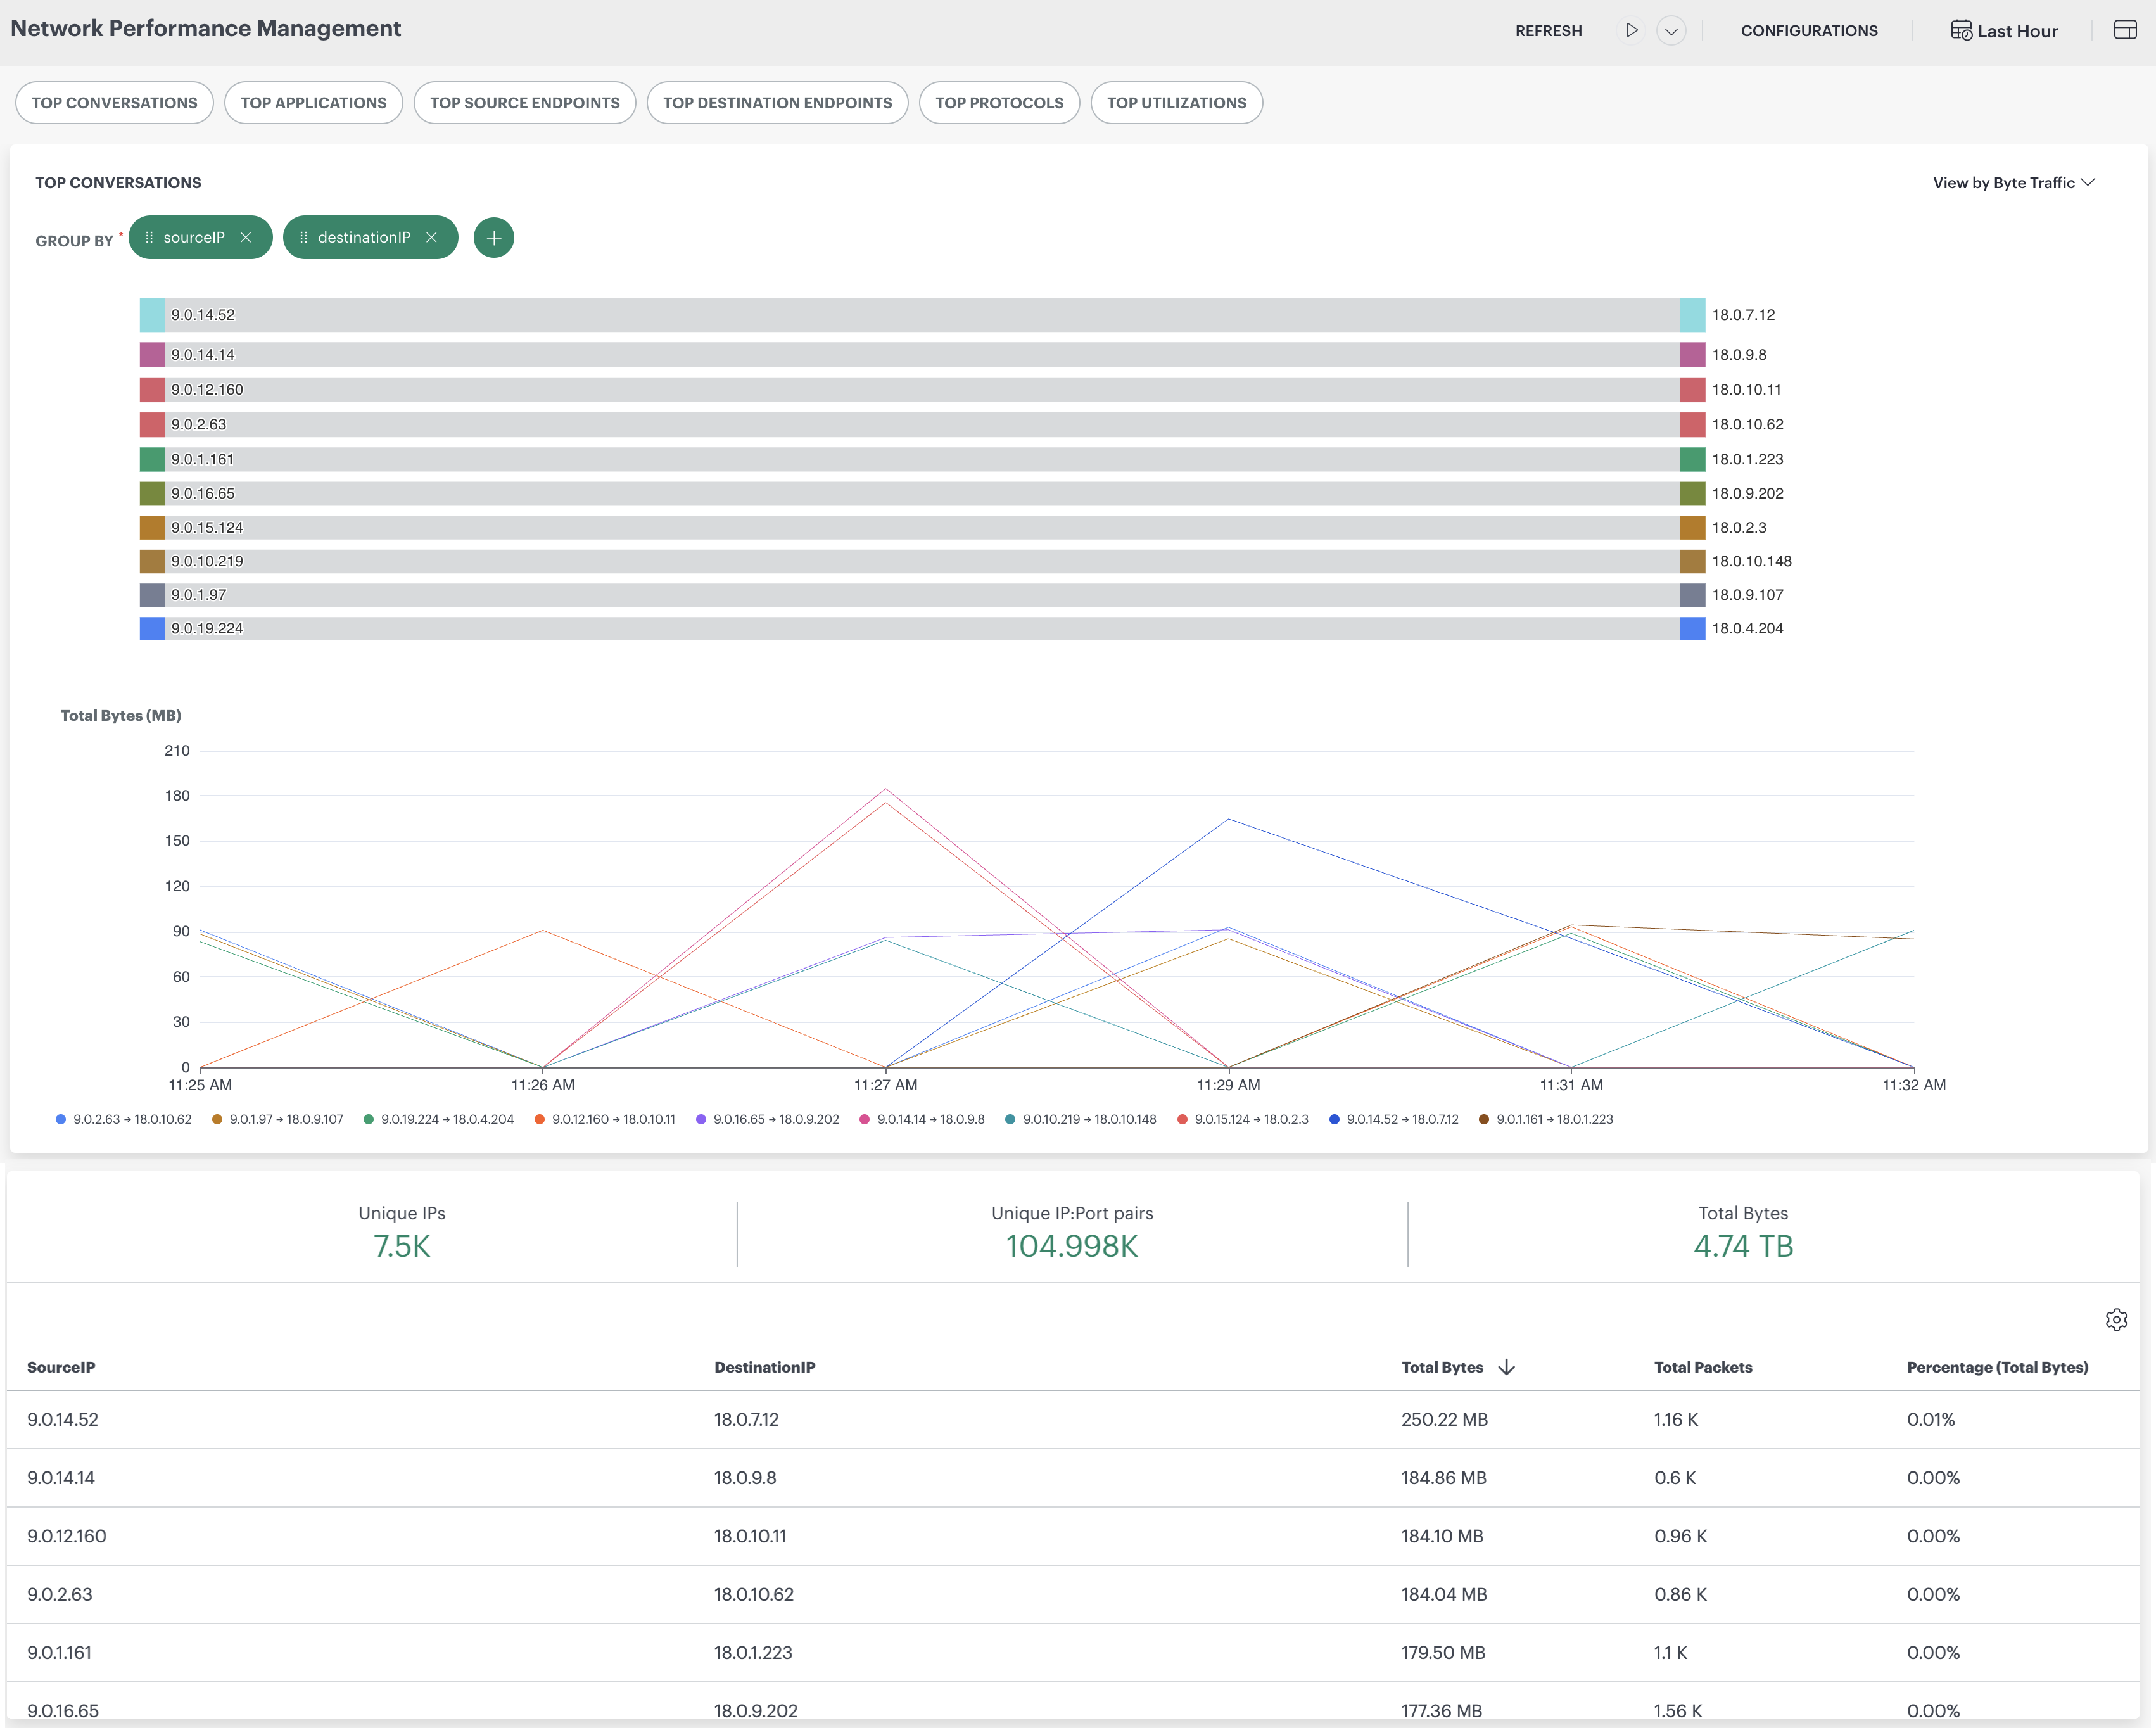
You can also access the NPM dashboard from the Infrastructure > Search page.
Navigate to Infrastructure > Search.
Under OTHERS, click on Network Device from the left side of the page.
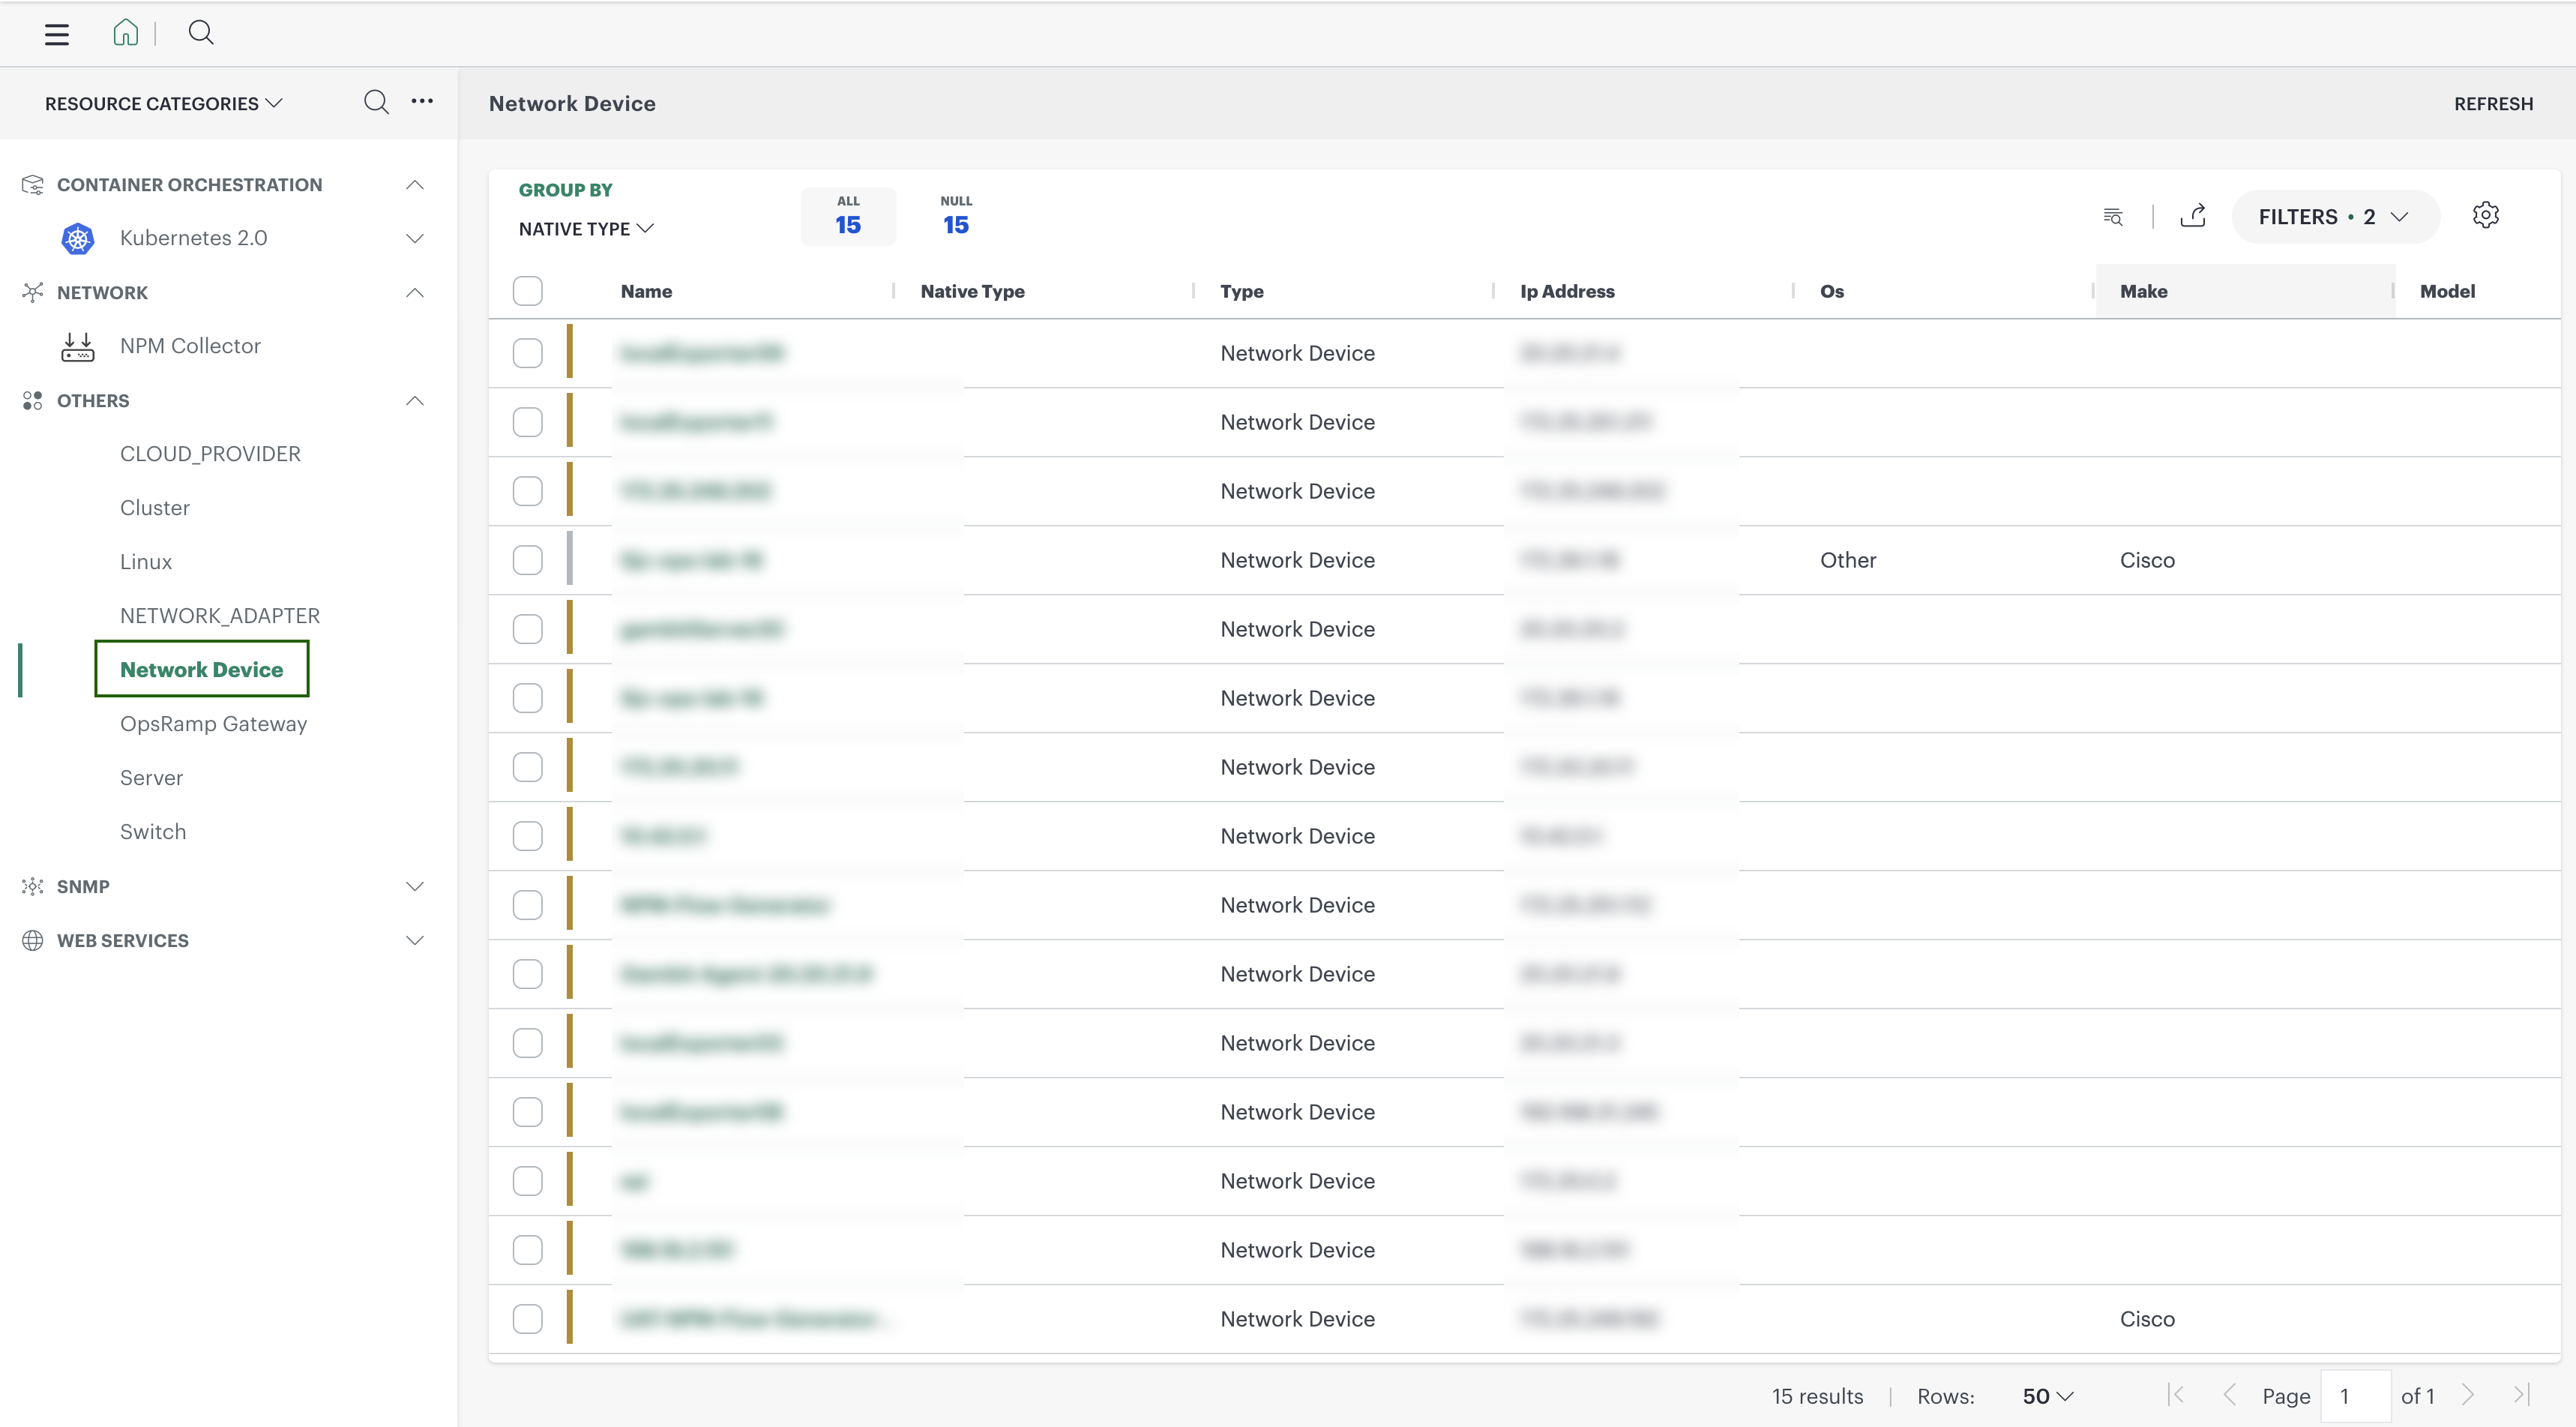
Click on a resource link.The resource details page is displayed.
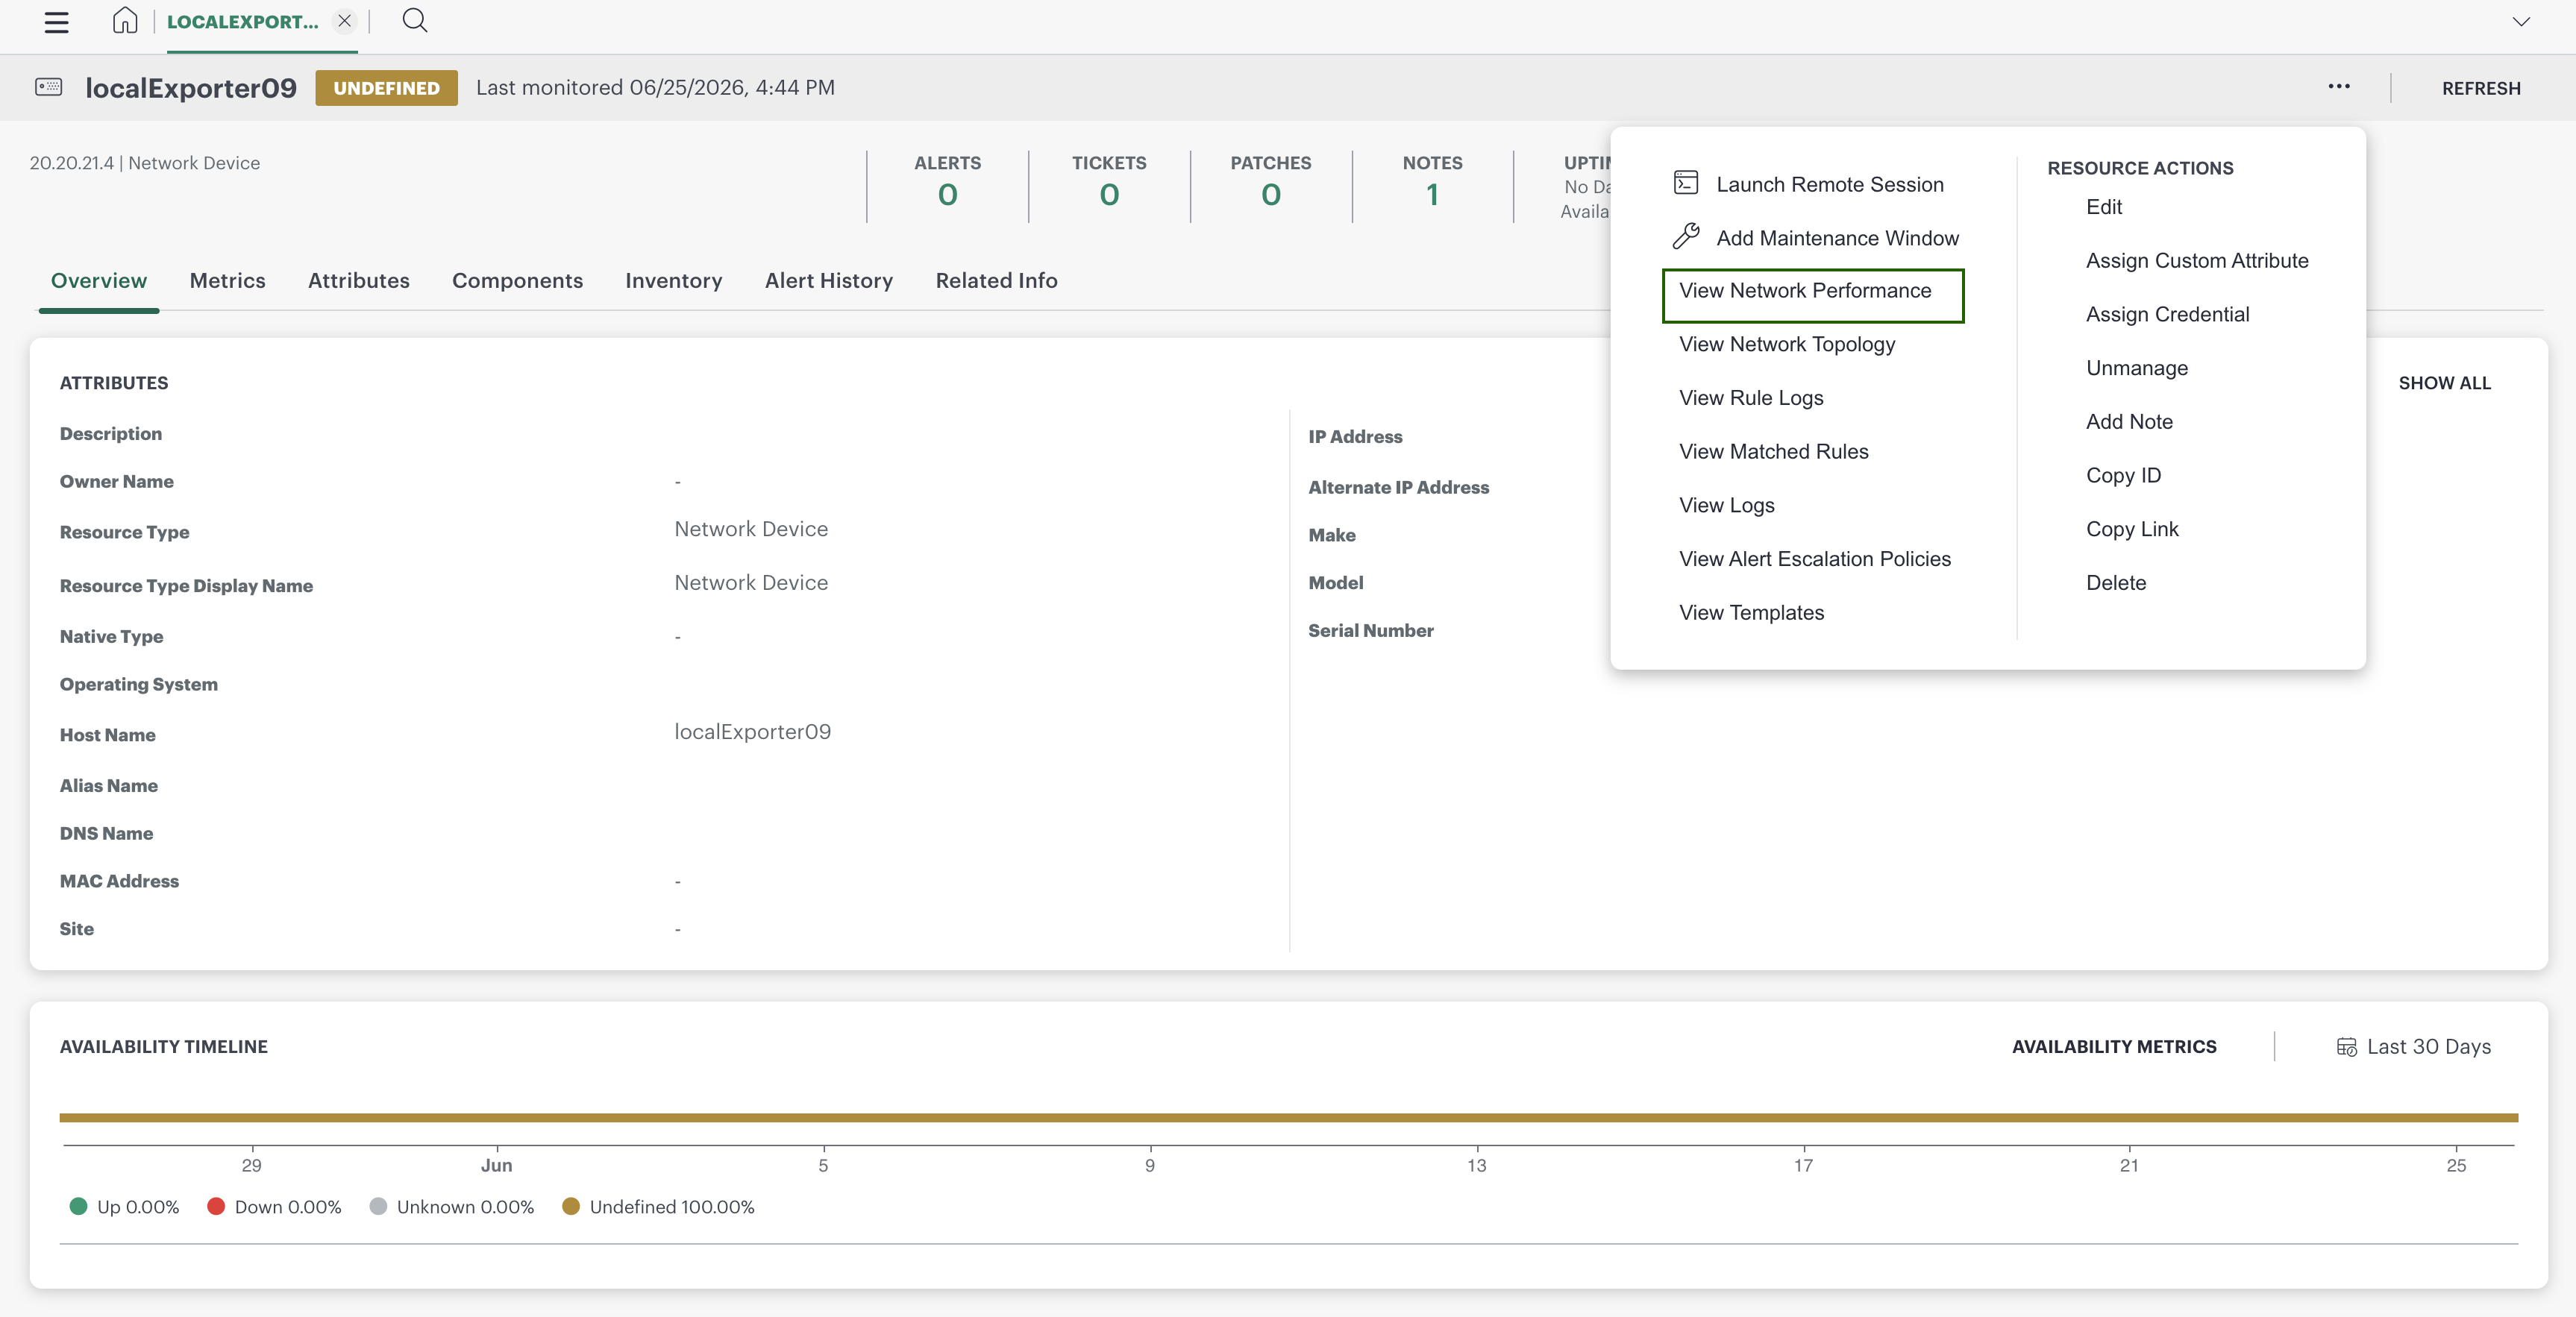
- Click the three-dot icon, select View Network Performance to navigate to NPM dashboard.
From the NPM dashboard, you can:
Filter the metric data based on Top N, network devices, interfaces, flow type, and time.
View all the widgets like Summary, Top Conversations, Top Applications, Top Source Endpoints, Top Destination Endpoints, Top Protocols, and Top Utilizations.
See Network Performance Management for more information.
Note
- The configured NodePort range is not retained after a Gateway restart or upgrade. Reapply the NodePort range after each restart or upgrade, and verify that the collector service is listening on the configured port.
- The NodePort range is configured per node. For a multi-node cluster, apply the configuration and restart each node. If a node is not configured, flows received by that node may be dropped, resulting in incomplete flow data.
- If the earlier version has Single LB controller enabled, then the same should be enabled on the latest gateway as well; otherwise, it will not be able to scale with the load and also we would face source IP NATing issues.
Version History
| Application Version | Bug fixes / Enhancements |
|---|---|
| 4.0.0 |
|
| 3.0.0 |
|
| 2.0.0 |
|
| 1.0.0 | Initial support for monitoring, dashboard capabilities, and visualization. |