Introduction
MariaDB replication cluster typically refers to a cluster of MariaDB servers that use replication for data synchronization. MariaDB supports various forms of replication, but a common scenario involves using Galera Cluster for synchronous multi-master replication. There is also a traditional master-slave MariaDB replication setup involving one master server and one or more slave servers. This form of replication is asynchronous, meaning that changes made on the master are propagated to the slaves after some delay.
Galera Cluster
Galera Cluster is a synchronous multi-master cluster for MariaDB. It provides high availability and fault tolerance by allowing multiple nodes to write to the cluster simultaneously. Galera uses a certification-based replication mechanism, ensuring consistency across all nodes.
Traditional master-slave Cluster
- Master Server:
- The master server is the primary server where write operations (INSERT, UPDATE, DELETE) are performed.
- It maintains the original dataset.
- It logs changes made to the database in the binary log.
- Slave Server(s):
- Slave servers are read-only replicas of the master.
- They replicate changes from the master, effectively mirroring its dataset.
- Slaves can be used for read scaling and backup purposes.
- This form of replication is suitable for scenarios where read scaling and data redundancy are primary considerations, and some delay in data consistency is acceptable.
Key Use cases
Discovery Use cases
- It discovers the MariaDB cluster and its component Mysql instances.
- Publishes relationships between resources to have a topological view and ease of maintenance.
Monitoring Use cases
- Provides metrics related to job scheduling time and status etc..
- Concern alerts will be generated for each metric to notify the administrator regarding the issue with the resource.
Supported Target Version
- Validated on MariaDB version 10.3.35-MariaDB
Prerequisites
- OpsRamp Classic Gateway(Linux) 14.0.0 and above.
- OpsRamp Nextgen Gateway version 14.0.0 and above.
- Provided IpAddress/hostname, Credentials (SSH and MariaDB database) should work for accessing MariaDB cluster.
- The SSH credentials should be same for all the MariaDB cluster nodes
- The MariaDB credentials should be the same for all the MariaDB node instances.
- Ensure that the provided IP address/host name, port, and credentials are valid and accessible for successful integration.
- Verify network connectivity from the gateway using:
ping <IP Address/Host Name> - Check port accessibility using:
telnet <IP Address/Host Name> <Port> - Validate SSH access using the provided credentials:
ssh -p <Port> <username>@<IP Address/Host Name>
- Verify network connectivity from the gateway using:
- Verify MariaDB Database connection to end device mysql
-h <NodeIP / HostName> -u <userName> -P 3306 -p<password>.
Hierarchy of MariaDB Cluster
- For MariaDB cluster:
- MariaDB Cluster
- MariaDB Server
- MariaDB Database
- MariaDB Server
- MariaDB Cluster
- For a standalone MariaDB server:
- MariaDB Server
- MariaDB Database
Notes: For the execution of remote SSH/CLI commands, ensure the provision of SSH credentials for the MariaDB server and credentials for the specific MariaDB instance.
Supported Metrics
Click here to view the supported metrics
| Native Type | Metric Name | Display Name | Units | Version | Description |
|---|---|---|---|---|---|
| MariaDB Cluster | mariadb_cluster_NodesCount | MariaDB Cluster Nodes Count | count | 1.0.0 | The number of nodes in the MariaDB cluster |
| MariaDB Server | mariadb_server_InternalConnectionErrors | MariaDB Server Internal Connection Errors | count | 1.0.0 | The number of connections refused due to internal errors in the server, such as failure to start a new thread or an out-of-memory condition. |
| mariadb_server_MaxConnectionErrors | MariaDB Server Max Connection Errors | count | 1.0.0 | The number of connections refused due to internal server errors. | |
| mariadb_server_AbortedClients | MariaDB Server Aborted Clients | count | 1.0.0 | The number of connections that were aborted because the client died without closing the connection properly. | |
| mariadb_server_Uptime | MariaDB Server Uptime | m | 1.0.0 | MariaDB server uptime in minutes | |
| mariadb_server_databasesCount | MariaDB Server Databases Count | count | 3.0.0 | Total number of databases in MariaDB Server | |
| MariaDB Database | mariadb_database_tableCount | MariaDB Database Table Count | count | 3.0.0 | Counts the number of tables in the specified database. |
| Native Type | Metric Name | Display Name | Units | Application Version | Description |
|---|---|---|---|---|---|
| MariaDB Server | mariadb_server_RxBytes | MariaDB Server Received Bytes | Bytes | 1.0.0 | The number of bytes received from all clients. |
| mariadb_server_TxBytes | MariaDB Server Transfer Bytes | Bytes | 1.0.0 | The number of bytes sent to all clients. | |
| mariadb_server_InnodbBufferPoolWriteRequests | MariaDB Server InnoDB Buffer Pool Write Requests | count | 1.0.0 | The number of writes done to the InnoDB buffer pool. | |
| mariadb_server_InnodbRowLockWaits | MariaDB Server InnoDB Row Lock Waits | count | 1.0.0 | The number of times operations on InnoDB tables had to wait for a row lock. | |
| mariadb_server_InnodbBufferPoolPagesFree | MariaDB Server InnoDB Buffer Pool Pages Free | count | 1.0.0 | The number of free pages in the InnoDB Buffer Pool. | |
| mariadb_server_InnodbBufferPoolPagesTotal | MariaDB Server InnoDB Buffer Pool Pages Total | count | 1.0.0 | The total number of pages in the InnoDB Buffer Pool. | |
| mariadb_server_InnodbDataPendingWrites | MariaDB Server InnoDB Data Pending Writes | count | 1.0.0 | The current number of pending writes | |
| mariadb_server_InnodbDataPendingReads | MariaDB Server InnoDB Data Pending Reads | count | 1.0.0 | The current number of pending reads | |
| mariadb_server_InnodbBufferPoolDirtyPages | MariaDB Server InnoDB Buffer Pool Dirty Pages | count | 1.0.0 | The current number of dirty pages in the InnoDB buffer pool. | |
| mariadb_server_InnodbBufferPoolReads | MariaDB Server InnoDB Buffer Pool Reads | count | 1.0.0 | The number of logical reads that InnoDB could not satisfy from the buffer pool, and had to read directly from the disk. | |
| mariadb_server_InnodbBufferPoolUtilization | MariaDB Server InnoDB Buffer Pool Utilization | % | 1.0.0 | The utilization of the InnoDB Buffer Pool. shown as fraction | |
| mariadb_server_InnodbRowLockTime | MariaDB Server InnoDB Row Lock Time | ms | 1.0.0 | The total time spent in acquiring row locks for InnoDB tables, in milliseconds. | |
| mariadb_server_InnodbBufferPoolReadRequests | MariaDB Server InnoDB Buffer Pool Read Requests | count | 1.0.0 | The number of reads done to the InnoDB buffer pool. | |
| mariadb_server_InnodbDataReads | MariaDB Server InnoDB Data Reads | count | 1.0.0 | The total number of data reads (OS file reads). | |
| mariadb_server_InnodbDataWrites | MariaDB Server InnoDB Data Writes | count | 1.0.0 | The total number of data writes. |
| Native Type | Metric Name | Display Name | Units | Application Version | Description |
|---|---|---|---|---|---|
| MariaDB Server | mariadb_server_SSLClientConnects | MariaDB Server SSL Client Connects | count | 1.0.0 | The number of SSL connection attempts to an SSL-enabled master. |
| mariadb_server_Connections | MariaDB Server Connections | count | 1.0.0 | The number of connection attempts (successful or not) to the MySQL server. | |
| mariadb_server_AbortedConnects | MariaDB Server Aborted Connects | count | 1.0.0 | The number of failed attempts to connect to the MySQL server. | |
| mariadb_server_MaxConnections | MariaDB Server Max Connections | count | 1.0.0 | Max Limit of Connections. | |
| mariadb_server_ActiveThreads | MariaDB Server Active Threads | count | 1.0.0 | MySQL Connected Threads count | |
| mariadb_server_CreatedThreads | MariaDB Server Created Threads | count | 1.0.0 | The number of threads created to handle connections. If Threads_created is big, you may want to increase the thread_cache_size value. The cache miss rate can be calculated as Threads_created/Connections. | |
| mariadb_server_CachedThreads | MariaDB Server Cached Threads | count | 1.0.0 | MySQL Cached Threads count | |
| mariadb_server_ThreadsRunning | MariaDB Server Threads Running | count | 1.0.0 | The number of threads that are not sleeping. | |
| mariadb_server_SelectCommands | MariaDB Server Select Commands | count | 1.0.0 | The number of times SELECT command has been executed | |
| mariadb_server_DeleteCommands | MariaDB Server Delete Commands | count | 1.0.0 | The number of times Delete command has been executed | |
| mariadb_server_InsertCommands | MariaDB Server Insert Commands | count | 1.0.0 | The number of times Insert command has been executed | |
| mariadb_server_RollbackCommands | MariaDB Server Rollback Commands | count | 1.0.0 | The number of times RollBack command has been executed | |
| mariadb_server_DropTableCommands | MariaDB Server DropTable Commands | count | 1.0.0 | The number of times Drop Table command has been executed | |
| mariab_server_DropUserCommands | MariaDB Server Drop User Commands | count | 1.0.0 | The number of times DROP USER command has been executed. | |
| mariadb_server_DropDatabaseCommands | MariaDB Server Drop Database Commands | count | 1.0.0 | The number of times DROP DATABASE command has been executed | |
| mariadb_server_CreateTableCommands | MariaDB Server Create Table Commands | count | 1.0.0 | The number of times CREATE TABLE command has been executed | |
| mariadb_server_CreateUserCommands | MariaDB Server Create User Commands | count | 1.0.0 | The number of times CREATE USER command has been executed | |
| mariadb_server_CreateDatabaseCommands | MariaDB Server Create Database Commands | count | 1.0.0 | The number of times CREATE DATABASE command has been executed | |
| mariadb_server_SlowQueryCount | MariaDB Server Slow Query Count | count | 1.0.0 | show global status like 'Slow_queries' | |
| mariadb_server_OpenTables | MariaDB Server OpenTables | count | 1.0.0 | The number of tables that have been opened with my_open(). | |
| mariadb_server_ImmediateTableLocks | MariaDB Server Immediate Table Locks | count | 1.0.0 | The number of times that a request for a table lock could be granted immediately. | |
| mariadb_server_diskTempTablesCreated | MariaDB Server Disk Temp Tables Created | count | 1.0.0 | The rate of temporary tables created by second. | |
| mariadb_server_OpenFiles | MariaDB Server OpenFiles | count | 1.0.0 | The number of files that have been opened with my_open() (a mysys library function). Parts of the server that open files without using this function do not increment the count | |
| mariadb_server_TempFilesCreated | MariaDB Server Temp Files Created | count | 1.0.0 | The rate of temporary files created by second. | |
| MariaDB Database | mariadb_database_totalFreeSpace | MariaDB Database Total Free Space | Bytes | 3.0.0 | This represents the amount of free space within the database tables, which can occur due to deletions or updates that leave empty space. |
| Native Type | Metric Name | Display Name | Units | Application Version | Description |
|---|---|---|---|---|---|
| MariaDB Database | mariadb_database_totalSize | MariaDB Database Total Size | Bytes | 3.0.0 | The total size of a database refers to the combined size of all the data stored in the database, including both the data and index files. |
| mariadb_database_dataSize | MariaDB Database Data Size | Bytes | 3.0.0 | This is the size of the actual data stored in the tables. It represents the amount of space occupied by the rows in the tables. | |
| mariadb_database_indexSize | MariaDB Database Index Size | Bytes | 3.0.0 | This is the size of the indexes associated with the tables in the database. Indexes improve the speed of data retrieval operations but also consume additional space. |
Default Monitoring Configurations
MariaDB has default Global Device Management Policies, Global Templates, Global Monitors and Global metrics in OpsRamp. Users can customize these default monitoring configurations as per their business use cases by cloning respective global templates and global Device Management Policies. OpsRamp recommends doing this activity before installing the app to avoid noise alerts and data.
Default Global Device Management Policies
OpsRamp has a Global Device Management Policy for each Native Type of MariaDB. You can find those Device Management Policies at Setup > Resources > Device Management Policies, search with suggested names in global scope. Each Device Management Policy follows below naming convention:
{appName nativeType - version}Ex: mariadb MariaDB Cluster - 1(i.e, appName = mariadb, nativeType = MariaDB Cluster , version = 1)
Default Global Templates
OpsRamp has a Global template for each Native Type of MariaDB. You can find those templates at Setup > Monitoring > Templates, search with suggested names in global scope. Each template follows below naming convention:
{appName nativeType 'Template' - version}Ex: mariadb MariaDB Cluster Template- 1(i.e, appName = mariadb, nativeType = MariaDB Cluster, version = 1)
Default Global Monitors
OpsRamp has a Global Monitors for each Native Type which has monitoring support. You can find those monitors at Setup > Monitoring > Monitors, search with suggested names in global scope. Each Monitors follows below naming convention:
{monitorKey appName nativeType - version}Ex: MariaDB Cluster Monitor mariadb MariaDB Cluster 1 (i.e, monitorKey =MariaDB Cluster Monitor, appName = mariadb, nativeType = MariaDB Cluster, version = 1)
Configure and Install the MariaDB Integration
- From All Clients, select a client.
- Go to Setup > Account.
- Select the Integrations and Apps tab.
- The Installed Integrations page, where all the installed applications are displayed.
Note: If there are no installed applications, it will navigate to the Available Integrations and Apps page. - Click + ADD on the Installed Integrations page. The Available Integrations and Apps page displays all the available applications along with the newly created application with the version.
Note: You can even search for the application using the search option available. Also you can use the All Categories option to search. - Click ADD in the MariaDB application.
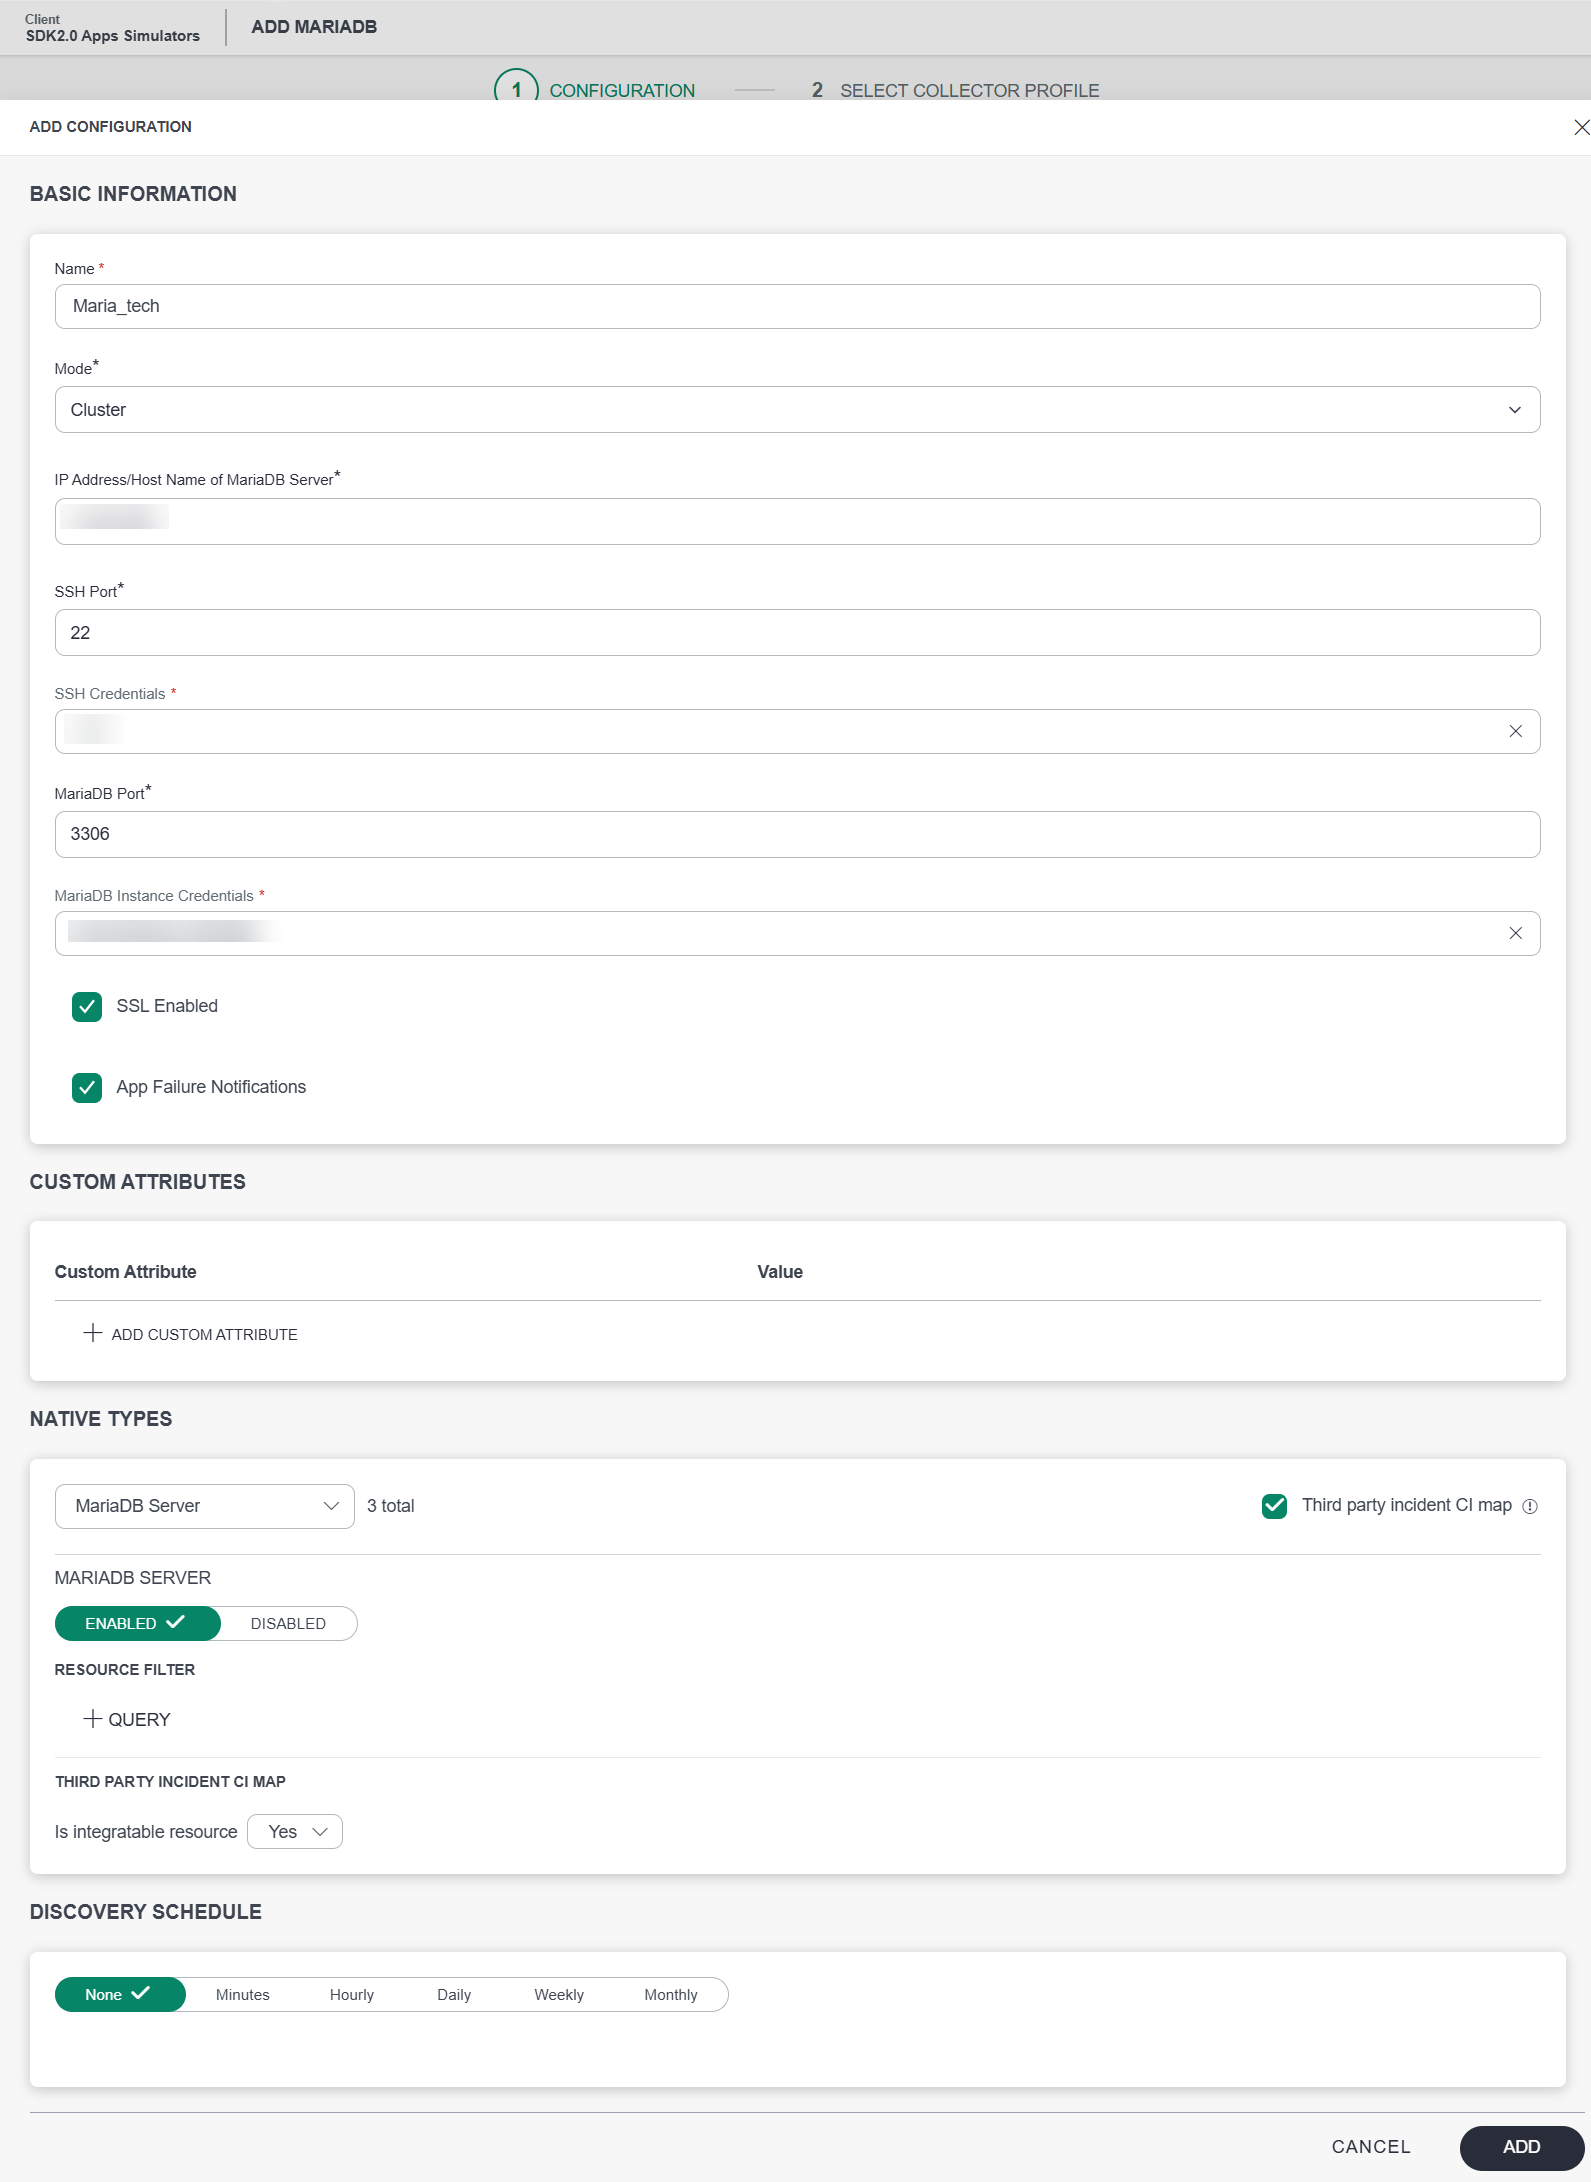
- In the Configurations page, click + ADD. The Add Configuration page appears.
- Enter the below mentioned BASIC INFORMATION:
| Functionality | Description | Field Type |
|---|---|---|
| Name | Enter the name for the configuration. | String |
| Mode | Select the type of MariaDB Mode you are integrating:Available OptionsStandalone- A single MariaDB Node that operates independently without any clustering configuration.Cluster- A MariaDB Cluster instance that spans multiple nodes | Dropdown |
| IP Address/Host Name of MariaDB Server | Enter the IpAddress/HostName. | String |
| SSH Port | SSH Port Note: By default the SSH Port 22 is displayed. | Integer |
| SSH Credentials | Select the Credential from the drop-down list. Notes:
| Dropdown |
| MariaDB Port | MariaDB Port Notes: By default the MariaDB Port 3306 is displayed. | Integer |
| MariaDB Instance Credentials | Select the Credential from the drop-down list. Notes:
| Dropdown |
| SSL Enabled | When selected, you will be able to enable the SSL Enabled flag for secure (HTTPS) communication.Note: User should select SSL Enabled tag, only if the db user configured with ssl(--ssl). | Checkbox |
| App Failure Notifications | When selected, you will be notified in case of an application failure such as Connectivity Exception, Authentication Exception. | Checkbox |
Notes:
- Ip Address/Host Name and Port should be accessible from Gateway.
- App Failure Notifications: If turned on, you will be notified in case of an application failure that is, Connectivity Exception, Authentication Exception.
- Select the below mentioned Custom Attribute:
| Functionality | Description |
|---|---|
| Custom Attribute | Select the custom attribute from the drop down list box. |
| Value | Select the value from the drop down list box. |
Note: The custom attribute that you add here will be assigned to all the resources that are created by the integration. You can add a maximum of five custom attributes (key and value pair).
In the RESOURCE TYPE section, select:
- ALL: All the existing and future resources will be discovered.
- SELECT: You can select one or multiple resources to be discovered.
In the DISCOVERY SCHEDULE section, select Recurrence Pattern to add one of the following patterns:
- Minutes
- Hourly
- Daily
- Weekly
- Monthly
Click ADD.
Now the configuration is saved and displayed on the configurations page after you save it.
Note: From the same page, you may Edit and Remove the created configuration.
Under the ADVANCED SETTINGS, Select the Bypass Resource Reconciliation option, if you wish to bypass resource reconciliation when encountering the same resources discovered by multiple applications.
Note: If two different applications provide identical discovery attributes, two separate resources will be generated with those respective attributes from the individual discoveries.
Click NEXT.
(Optional) Click +ADD to create a new collector by providing a name or use the pre-populated name.
Select an existing registered profile.
Click FINISH.
The application is installed and displayed on the INSTALLED INTEGRATION page. Use the search field to find the installed integration.
Modify the Configuration
See Modify an Installed Integration or Application article.
Note: Select the MariaDB application.
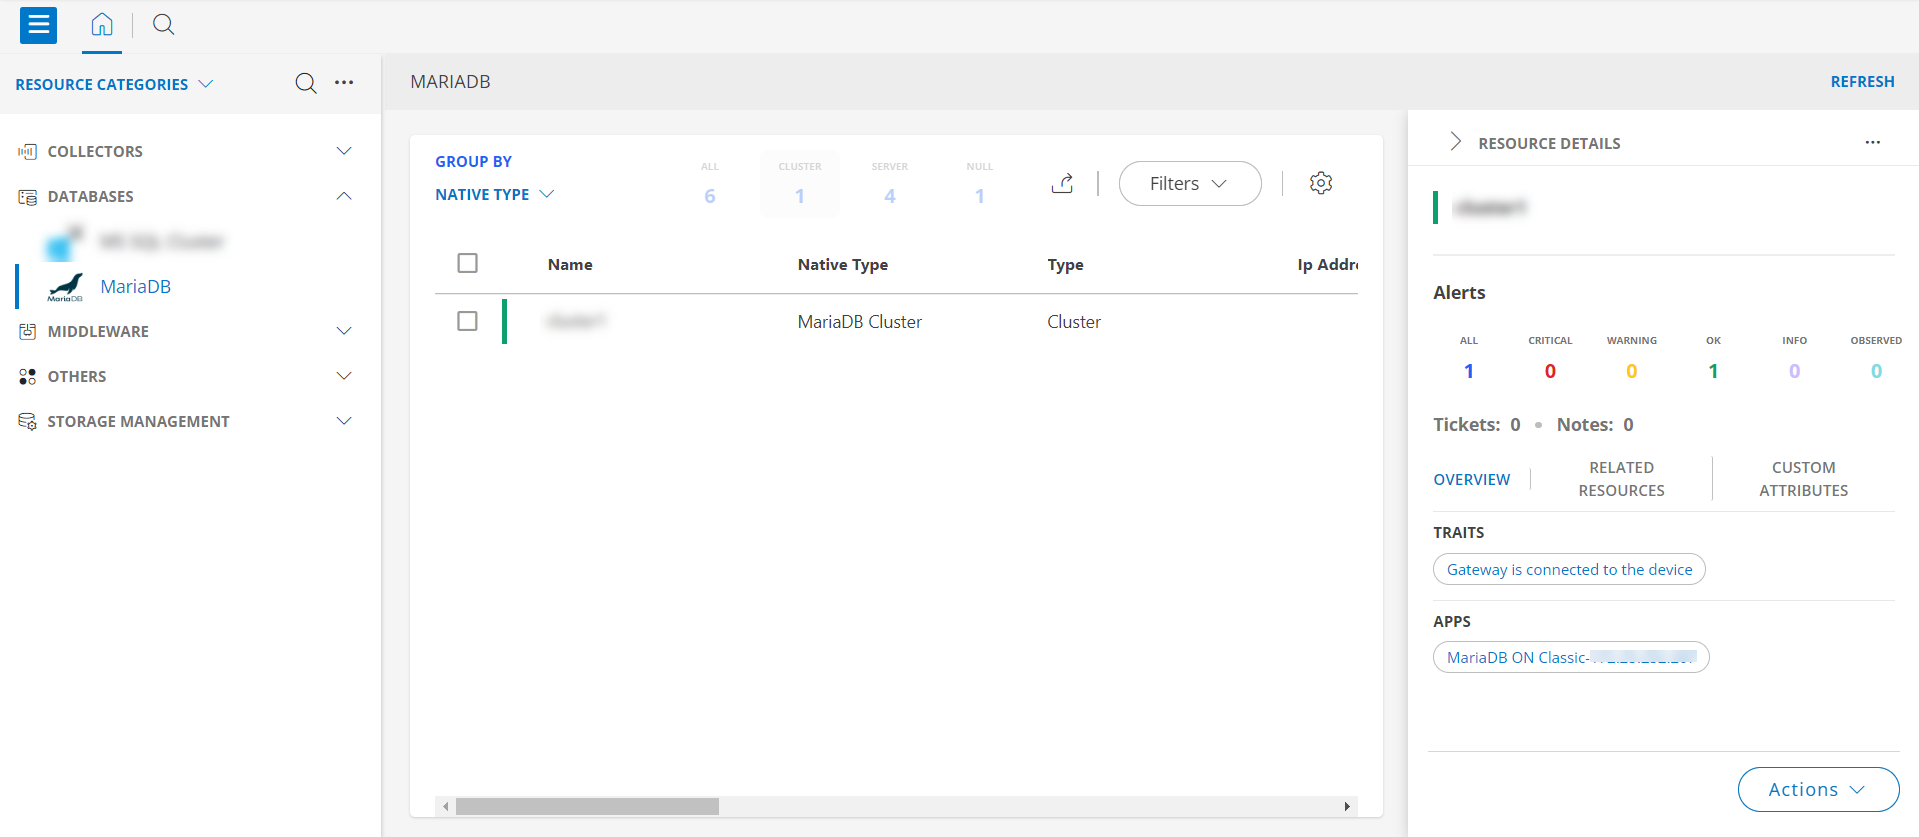
View MariaDB details
To discover resources for MariaDB,
- Navigate to Infrastructure > Search > DATABASES > MariaDB.
- The MARIADB page is displayed, select the application name.
- The RESOURCE DETAILS page appears from the right.
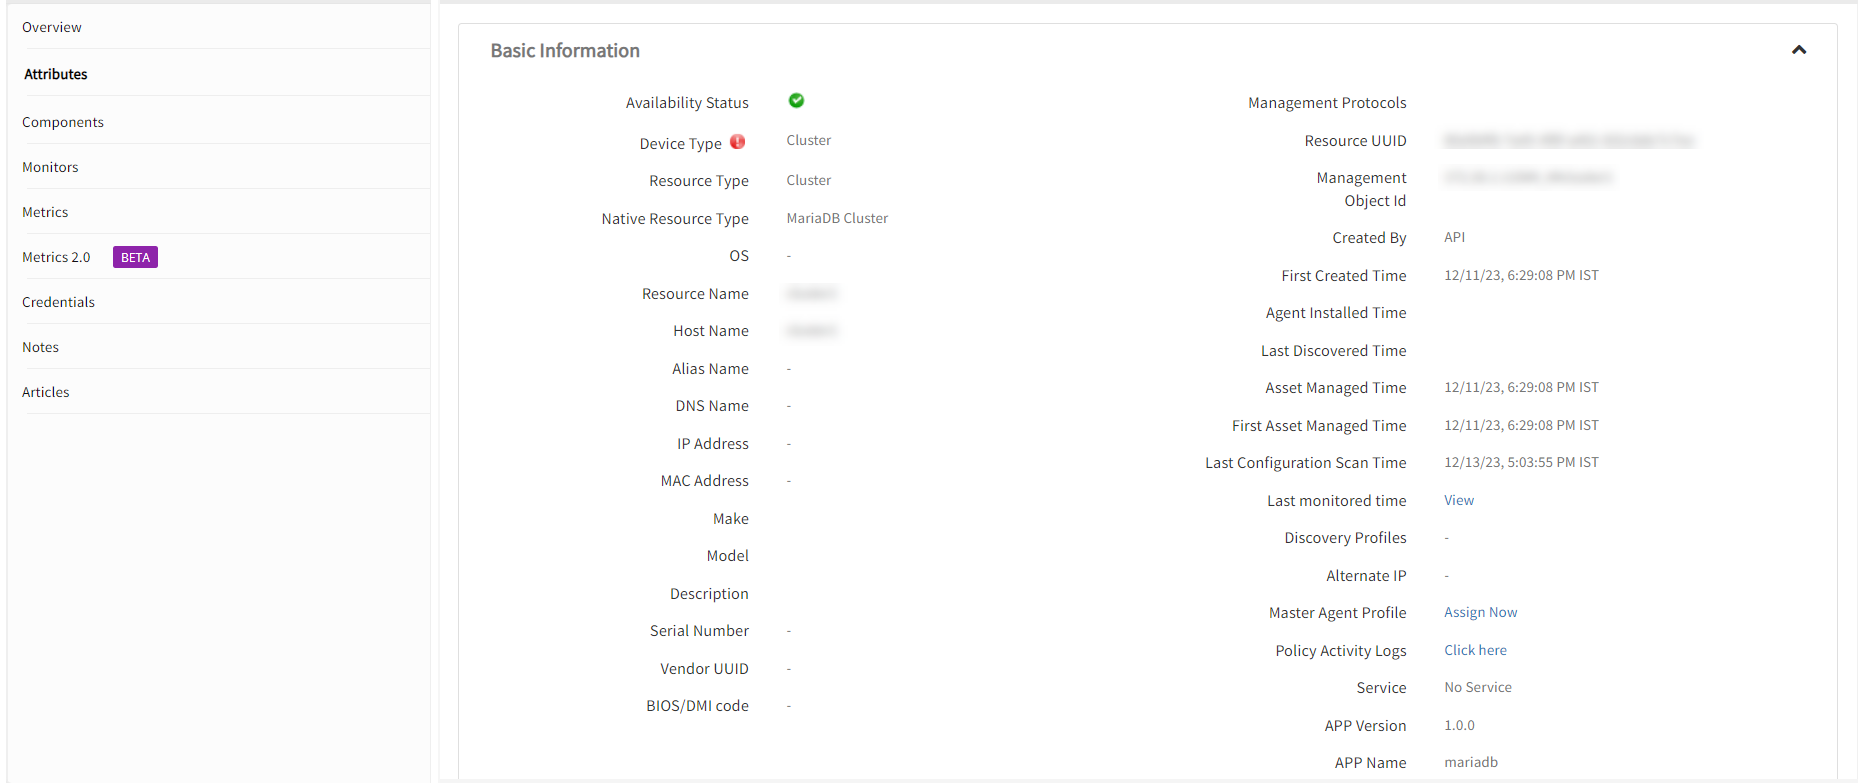
- Click the ellipsis (…) on the top right and select View details.
- Navigate to the Attributes tab to view the discovery details.
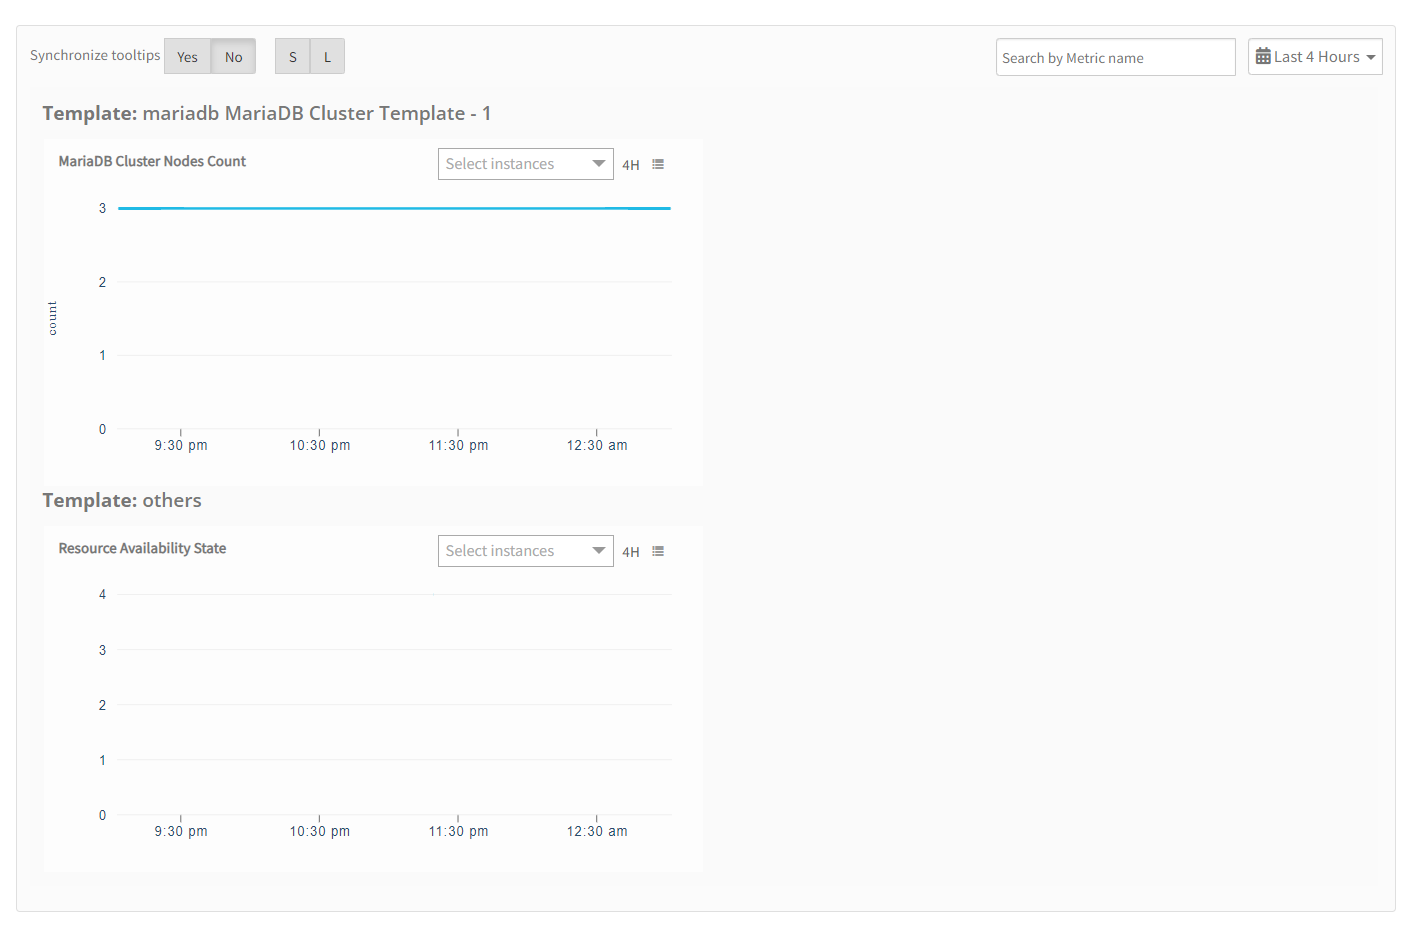
- Click the Metrics tab to view the metric details for MariaDB.
View resource metrics
To confirm MariaDB monitoring, review the following:
- Metric graphs: A graph is plotted for each metric that is enabled in the configuration.
- Alerts: Alerts are generated for metrics that are configured as defined for integration.
Resource Filter Input Keys
Click here to view the Supported Input Keys
| Resource Type | Supported Input Keys |
|---|---|
| All Types | resourceName |
| hostName | |
| aliasName | |
| dnsName | |
| ipAddress | |
| macAddress | |
| os | |
| make | |
| model | |
| MariaDB Server | datadir |
| MariaDB version | |
| Root Resource IPAddress | |
| Root Resource Name | |
| Root Resource HostName | |
| MariaDB Database | CATALOG NAME |
| DEFAULT CHARACTER SET NAME | |
| DEFAULT COLLATION NAME | |
| MariaDB Server Name | |
| SQL PATH | |
| Root Resource IPAddress | |
| Root Resource Name | |
| Root Resource HostName |
Supported Alert Custom Macros
Customize the alert subject and description with below macros then it will generate alert based on customisation.
Supported macros keys:
Click here to view the alert subject and description with macros
${resource.name}
${resource.ip}
${resource.mac}
${resource.os}
${resource.type}
${resource.make}
${resource.model}
${resource.serialnumber}
${resource.systemId}
${parent.resource.name}
${Custom attributes on the resource}
Risks, Limitations & Assumptions
- Application can handle Critical/Recovery failure alert notifications for below two cases when user enables App Failure Notifications in configuration
- Connectivity Exception
- Authentication Exception
- Application cannot control monitoring pause/resume actions based on above alerts. Metrics can be used to monitor PowerMax resources and can generate alerts based on the threshold values.
- OpsRamp has provided 22 as default Port for SSH and 3306 as default Port for MariaDB. Users can modify this value from the application configuration page at any point of time if required.
- Component level thresholds can be configured on each resource level.
- The Template Applied Time will only be displayed if the collector profile (Classic and NextGen Gateway) is version 18.1.0 or higher.
- The minimum supported version for the option to get the latest snapshot metric is Nextgen-14.0.0.
- This application supports both Classic Gateway and NextGen Gateway.
Version History
| Application Version | Bug fixes / Enhancements |
|---|---|
| 3.1.0 |
|
| 3.0.1 | Added support for the latest metrics, Activity Logger updates, and DebugHandler changes. |
| 3.0.0 | Support has been added for MariaDB databases. |
| 2.0.0 | Persona changes to support Cluster and Standalone MariaDB configurations. |
| 1.0.0 | Initial version with Discovery and Monitoring Implementations. |