Introduction
MicroK8s is a streamlined, lightweight Kubernetes solution designed for minimal operational overhead. It simplifies the deployment, scaling, and management of containerized applications. It offers the essential features of Kubernetes in a compact package, suitable for environments ranging from single-node setups to high-availability production clusters.
Note: MicroK8s is supported starting from Kubernetes agent version 17.0.0 and onward.
You can monitor the following Kubernetes components using MicroK8s:
- API Server (using Kubelite )
- Kube Controller (using Kubelite )
- Kube Scheduler (using Kubelite )
- KubeDNS / CoreDNS
- Kube State (Not installed by default in the MicroK8s Cluster)
- Metric Server (Not installed by default in the MicroK8s Cluster)
Configure MicroK8s
Step 1: Install and Configure the MicroK8s Integration
- From All Clients, select a client.
- Navigate to Setup > Integrations.
- The Installed Integrations page, where all the installed applications are displayed. If there are no installed applications, it will navigate to the Available Integrations and Apps page.
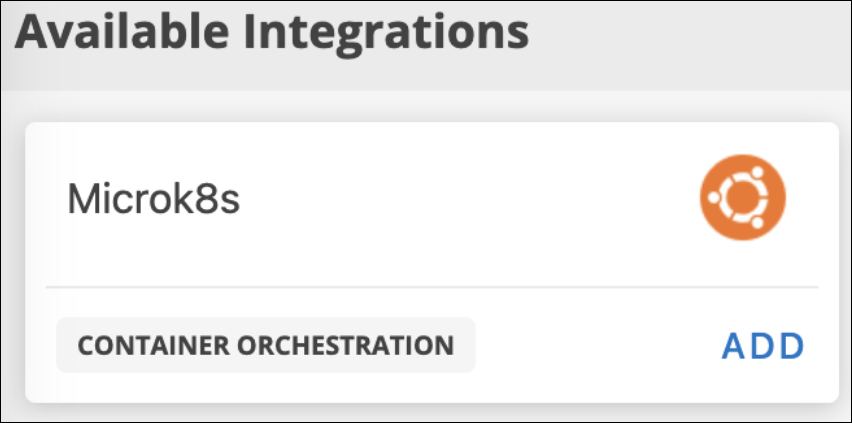
- Click + ADD on the Installed Integrations page. The Available Integrations page displays all the available applications along with the newly created application with the version. Note: You can even search for the application using the search option available. Also you can use the All Categories option to search.
- Click ADD on the Microk8s tile.
- In the Configurations page, click + ADD.
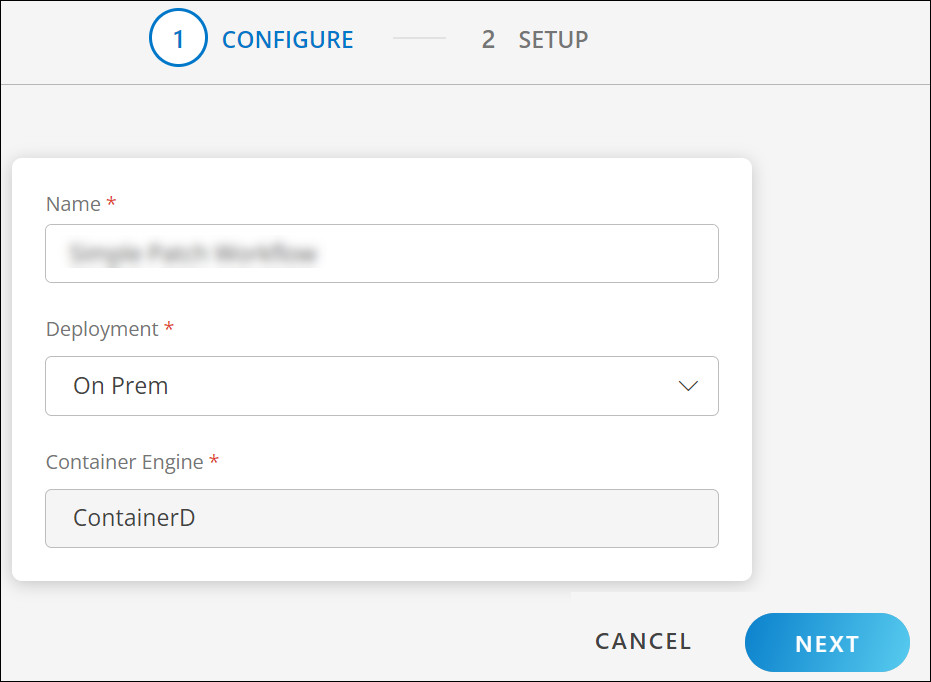
- In the configure page, enter the following details:
- Name: Name for the integration.
- Deployment type: On-prem or Cloud (AWS, GKE, and AKS)
- Container Engine: ContainerD (default container engine for Microk8s)
- Click Next.
Step 2: Deploy Agent on MicroK8s
Copy the YAML content and paste to a new file in kubernetes control plane (Example file name:
opsramp-agent.yaml)Execute the following command in kub controller plane.
microk8s kubectl apply -f opsramp-agent.yaml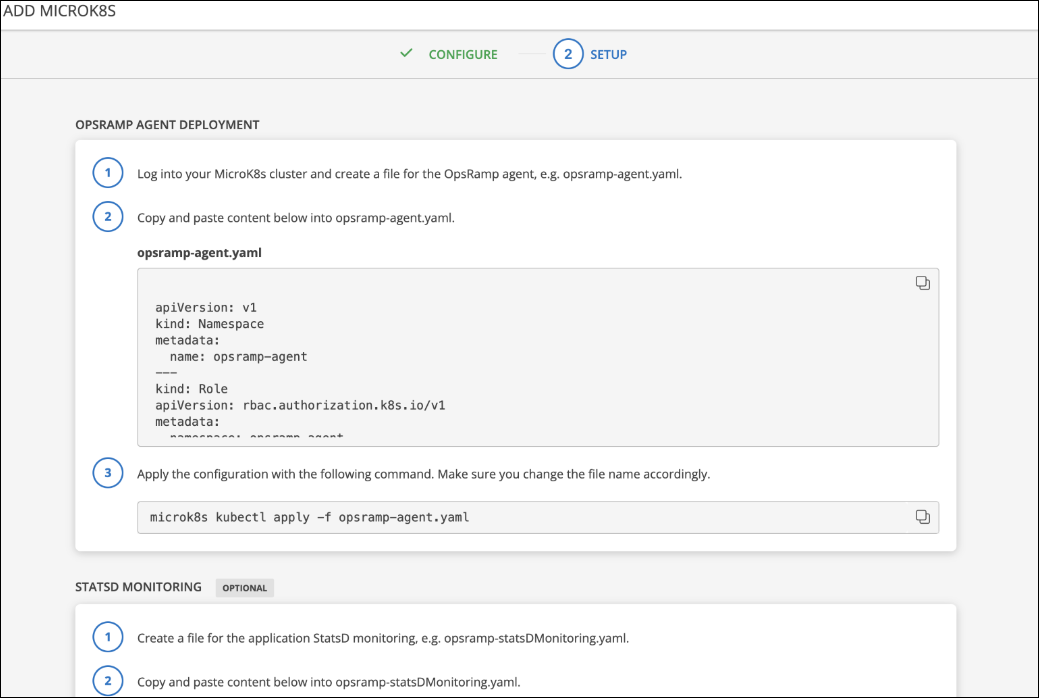
Note
Deploy only K8s agent in the node that belongs to the Kubernetes cluster, not the Agent installed using pkg (deb/rpm). If a regular agent (non-containerized agent) is already running in the worker nodes of the Kubernetes cluster, uninstall that agent using the pkg uninstall commands (dpkg -P opsramp-agent OR rpm -e opsramp-agent).Environment Variables in an Agent YAML file
You can adjust the following environment variable to change the Log Level of the agent:
  - name: LOG_LEVEL
    value: "warn"
Worker Agent: This deployment is responsible for collecting System Performance Metrics, Container Metrics (ContainerD), Kubelet, and all the container app metrics.
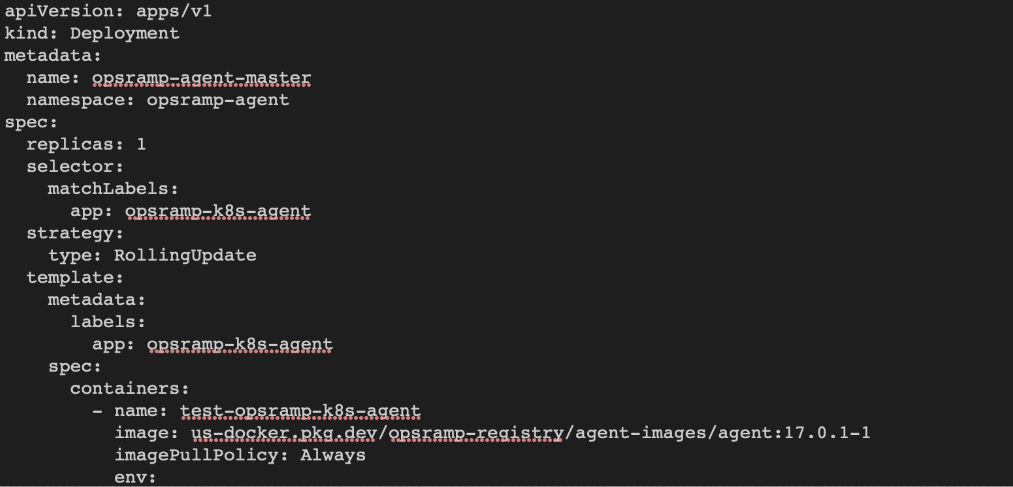
Master Agent: This deployment is responsible for collecting
microk8s-apiserver,microk8s-controller,microk8s-scheduler,microk8s-kube-state,microk8s-metrics-server,microk8s-coreDNS / kubeDNS metrics.
Note
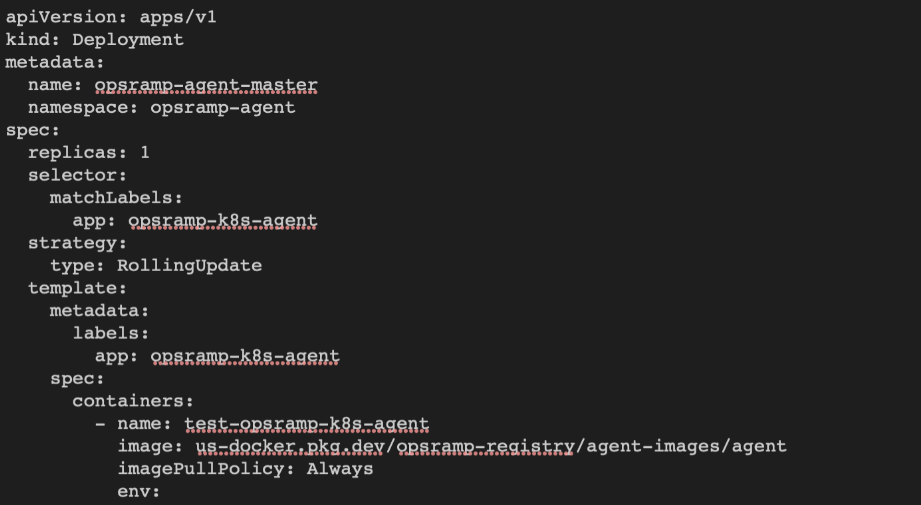
In the agent deployment file, OpsRamp agent pod is deployed with the latest image tag and ImagePullPolicy is set to Always for it.
This allows the agent to be run with the latest release version. If you restart the agent pod or daemonset at any time, the kubernetes cluster deploys the new agent pod(s) with the latest version if the agent image’s latest tag is updated by OpsRamp
To avoid this automatic updates of an agent version, add the image tag in the deployment file with the recent agent version before deploying the agent yaml to the cluster.
Examples: -
- Default image tag:
us-docker.pkg.dev/opsramp-registry/agent-images/agent - Change to:
us-docker.pkg.dev/opsramp-registry/agent-images/agent:17.0.1-1into both the places (opsramp-agent-master and opsramp-agent-worker) in the deployment file.
Connecting Agents using a proxy
- Use the following environment variables to connect agent.
CONN_MODE=proxy
PROXY_SERVER=<ProxyServerIP>
PROXY_PORT=<ProxyPort>
Note
Ensure to add these variables in both places (opsramp-agent-master and opsramp-agent-worker) in the deployment file.- If authentication is required for the proxy server, configure the credentials using the following command.
PROXY_USER=<User>
PROXY_PASSWORD=<Password>
Step 3: Apply Monitoring Templates and Create Device Management Policy
- Apply the appropriate Kubernetes template on the Integration resource (cluster resource) created after the deployment of the agent YAML file.
Apply the above Kubernetes components template only on the Integration resource, not on the nodes. - Apply the Container template and Kubelet Template on each node created under the Integration resource in the application. Alternatively, you can also create a Device Management Policy to do Step 1 and Step 2.
Step 4: (Optional) Configure the Docker and Kubernetes Event
Configure Docker/Container Events
The agent supports the following three Docker events:
- Start
- Kill
- Oom (Out of Memory)
By default, Docker events are disabled in the agent deployment YAML file. To enable the Docker events, change the DOCKER_EVENTS environment variable to TRUE.
Disabled by Default
- name: DOCKER_EVENTS
  value: "FALSE"
Enabled
- name: DOCKER_EVENTS
  value: "TRUE"
For agent versions 8.0.1-1 and above, the Docker events are sent as monitoring alerts. For the older versions of agent, the Docker events are sent as maintenance alerts to the OpsRamp alert browser.
Configure Kubernetes Events
OpsRamp Agent can forward the Kubernetes events that are generated in the cluster.
The events are categorized into the following two types:
- Node
- Other
By default, the agent forwards all the Kubernetes events without making any updates.
- To forward only selected events, you must edit the kube events config map in the YAML file.
- To remove the the event, remove it from the agent deployment YAML file.
To add a new event, add the event (Kube Event Reason) under the other category. If the reason matches with the actual Kubernetes event reason, events are forwarded as alerts.
By default, Kubernetes events are disabled in the agent deployment YAML file. To enable, change the K8S_EVENTS environment variable to TRUE.
Disabled by Default
- name: K8S_EVENTS
  value: "FALSE"
Enabled
- name: K8S_EVENTS
  value: "TRUE"
For agent versions 8.0.1-1 and above, the Kubernetes events are sent as monitoring alerts. For the older versions of agent, the Kubernetes events are sent as maintenance alerts to the OpsRamp alert browser.
By default, all events are converted as warning alerts. To forward any events with a different alert state, change the event name followed by alert state (Critical/Warning), as shown below.
node:
  - RegisteredNode:Critical
  - RemovingNode:Warning
  - DeletingNode
  - TerminatingEvictedPod
Events supported by default
| node | other |
|---|---|
|
|
Note
One can monitor pod events by adding the following kube event reasons to the other section of kube events config map in the YAML file.
- Failed
- InspectFailed
- ErrImageNeverPull
- Killing
- OutOfDisk
- HostPortConflict
List of Metrics
Explore the microk8s metrics list along with descriptions and the monitors they apply to.
Addons
Install Kube State and Metrics Server manually to fetch and monitor metrics.
- To deploy Kube State, get the latest version of the deployment YAML file from GitHub.
- To deploy Metrics Server, get the latest version of the deployment YAML file GitHub or, enable metrics-server from addons of Microk8s.
Configure Addons
Configure Kube state
Step 1:
- To monitor
Kube-state-metrics, use the right version of kube state YAML for the deployment according to the Kubernetes version of the cluster. - To install
kube-state-metrics, complete the following on the Kubernetes control plane node:- Clone the Kubernetes
kube-state-metricsGithub repo. - Run microk8s kubectl apply
-f kube-state-metrics/examples/standard/.
- Clone the Kubernetes
- When deployed, set the kube state service Cluster IP with an IP Address.
The agent requires the address to fetch the metrics from kube state. If Cluster IP is not set (Shown as NONE) modify theservice.yamlfile and setclusterIP: None.
Here is an example of the modified service.yaml file (version 1.9):
    apiVersion: v1
    kind: Service
    metadata:
      labels:
        app.kubernetes.io/name: kube-state-metrics
        app.kubernetes.io/version: 2.12.0
      name: kube-state-metrics
      namespace: kube-system
    spec:
      ports:
      - name: http-metrics
        port: 8080
        targetPort: http-metrics
      - name: telemetry
        port: 8081
        targetPort: telemetry
      selector:
        app.kubernetes.io/name: kube-state-metrics
Step 2:
- To check if
kube-state-metricsis installed in the cluster, run the following command on the control plane nodes:
The following sample output confirms thatmicrok8s kubectl get svc --all-namespaces | grep kube-state-metrics | grep -v grepkube-state-metricsis installed in the cluster.kube-system kube-state-metrics ClusterIP 10.96.186.34 <none> 8080/TCP,8081/TCP 19d
Configure Metrics-Server
Step 1:
- To monitor metrics-server, enable the metrics-server from addons of Microk8s by using following command.
microk8s enable metrics-server - Once enabled, metrics-server pod is deployed to the
kube-systemnamespace. Alternatively, you can use the following command to deploy:
microk8s kubectl apply -f https://github.com/kubernetes-sigs/metrics-server/releases/download/v0.3.7/components.yamlNote
Replace the version tag with the required version.Step 2:
- To see if metrics-server is installed in the cluster, run the following command on the control plane nodes:
The below sample output confirms thatmicrok8s kubectl get svc -n kube-system | grep metrics-servermetrics-serveris installed in the cluster.metrics-server ClusterIP 10.152.183.142 <none> 443/TCP 21m
Next Steps
After a discovery profile is created:
- View the integration, navigate to Infrastructure > Resources.
- Assign monitoring templates to the resource.
- Validate that the resource was successfully added to OpsRamp.