Overview
Once log collection is configured, you can view, search, and troubleshoot logs directly in the OpsRamp portal and no need to access the underlying pods or nodes directly.
Prerequisites
- Log Management is enabled for your client.
- At least one log source (pods or nodes) is actively collecting logs.
Accessing the logs
Navigate to Infrastructure > Logs to view collected logs.
- Default Logs Screen: Access your logs through the Logs UI.
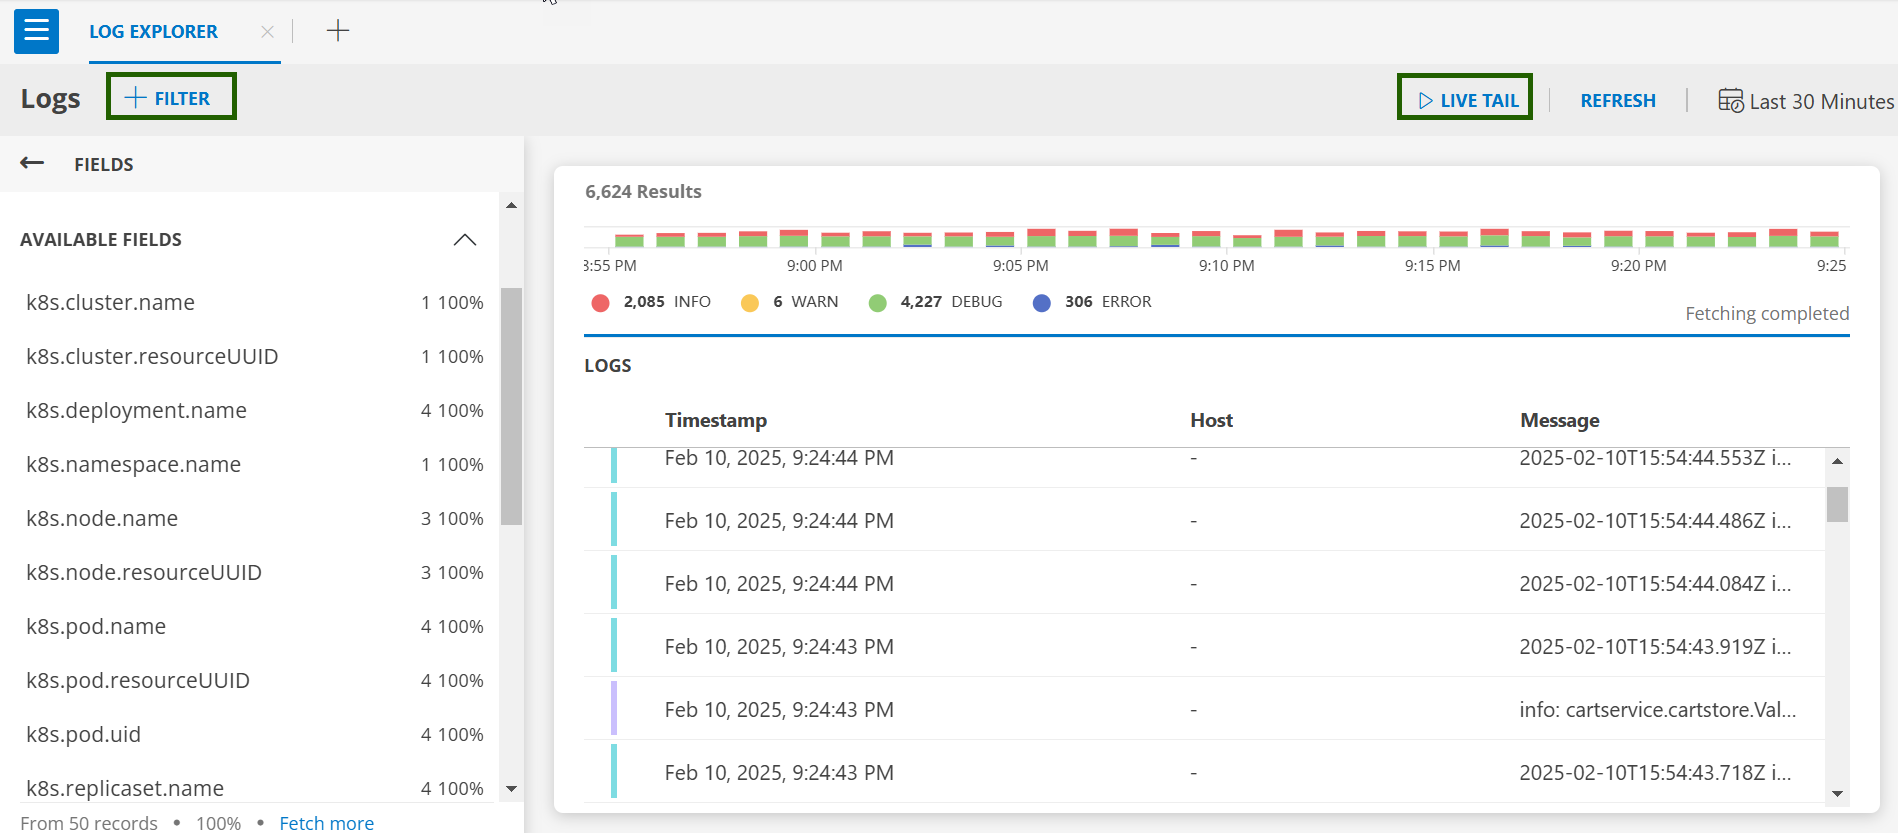
- Logs Filter: Click on +FILTER to select resource types and operators (e.g., Equals, Regex Not Contains).
- Live Tail: Click on LIVE TAIL to view real-time logs.
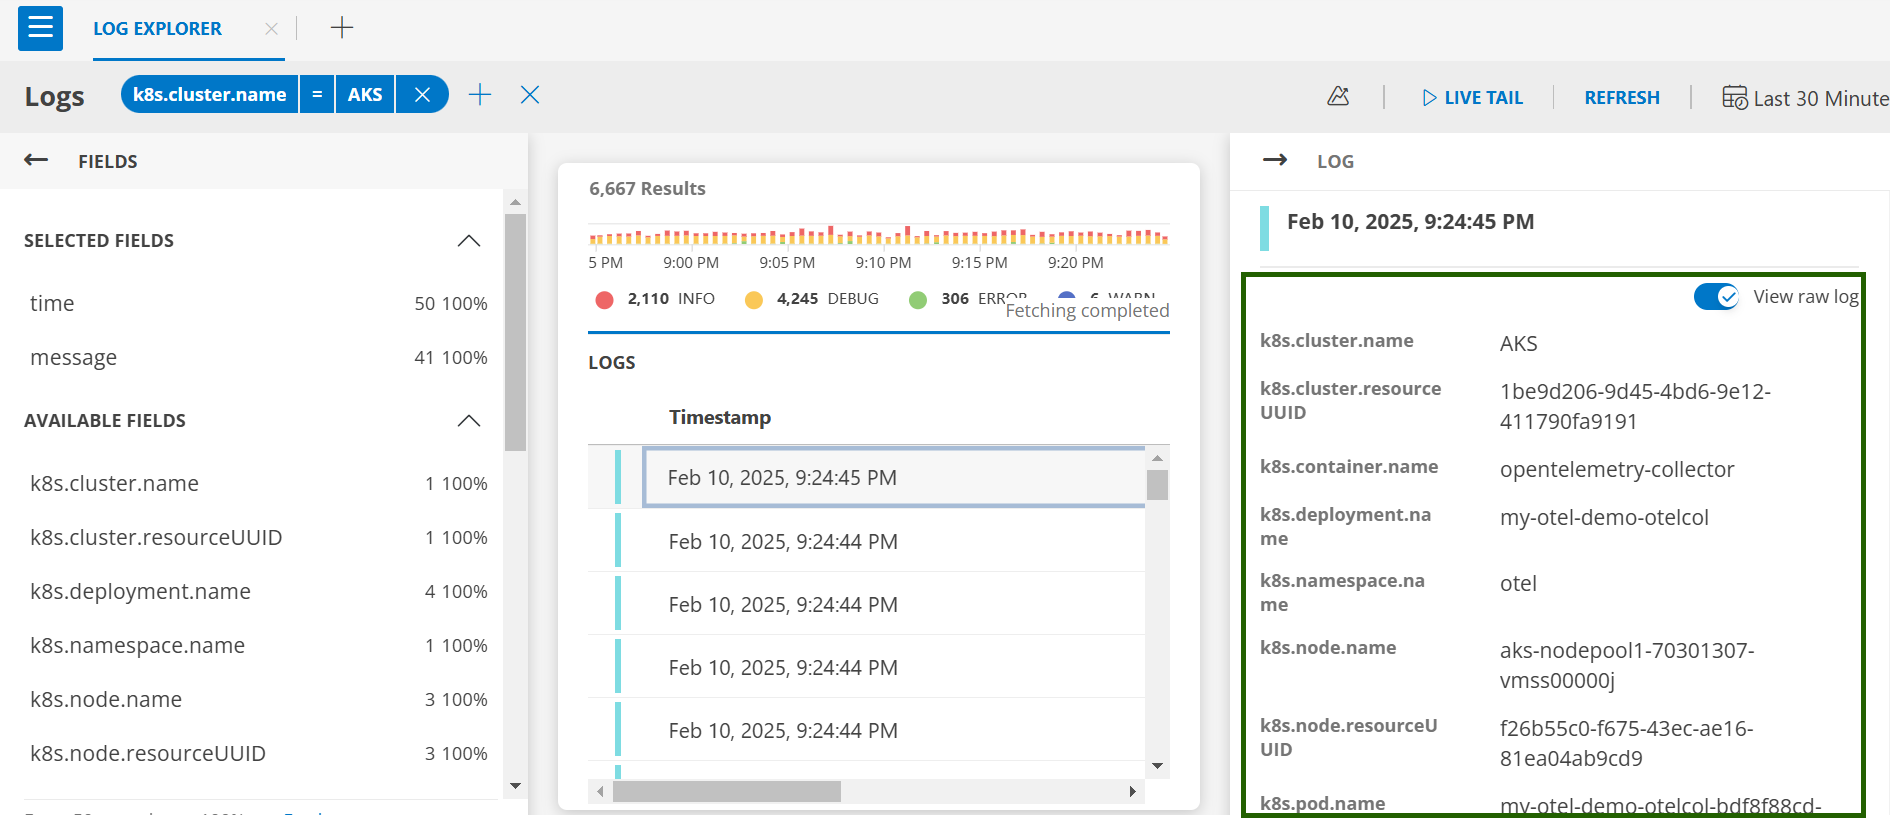
- Log Details: Click on any log entry for detailed information.
Once you edit the K8s ConfigMap and apply it to your cluster, the OpsRamp Agent will pick up the latest configuration changes within a few minutes. This version organizes the content into clear sections and uses straight forward language for better understanding.