| Supported Target Versions |
|---|
| Validated on IBM WebSphere Application Server (WAS) version 9.0.5.1. |
Application Version and Upgrade Details
| Application Version | Bug fixes / Enhancements |
|---|---|
| 1.0.1 | Resource Management object ID(moId) changes for IBM WAS Server and IBM WAS Applications Native Types |
| 1.0.0 | Initial deployment |
Introduction
IBM WebSphere Application Server is a flexible, secure Java server runtime environment for enterprise applications. Deploy and manage applications and services regardless of time, location, or device type. Integrated management and administrative tools provide enhanced security and control, while support for multi-cloud environments allows you to choose your deployment method. Continuous delivery capabilities and services help you respond at the speed your business needs.
In the WebSphere Application Server product, an application server collaborates with a web server to handle requests for web applications. The application server and web server communicate using a WebSphere HTTP plug-in for the web server.
Prerequisites
OpsRamp Classic Gateway 14.0.0 and above.
OpsRamp NextGen Gateway 14.0.0 and above.
Note: OpsRamp recommends using the latest Gateway version for full coverage of recent bug fixes, enhancements, etc.For Applications Manager to collect data from WebSphere Application Server, configurations are required at the Performance Monitoring Infrastructure (PMI) specification level.
Change the Performance Monitor Interface (PMI) Monitoring statistics from “None” to “Extended”. Deploy the perfServletApp.ear file in which is the PMI infrastructure to retrieve the performance information from WebSphere Application Server, and then restart the WebSphere Application Server.
Enable Performance Monitor Interface (PMI) Monitoring:
- Enable Performance Monitoring Infrastructure (PMI) in the application servers you want to monitor.
- Go to the IBM WAS Console, then navigate to Servers > All servers.
- Click the server name, then “Performance Monitoring Infrastructure (PMI)” under the “Performance” tab.
- Select the Enable Performance Monitoring Infrastructure checkbox and then check the Extended button under Currently monitored statistic set.
- Click Apply.
- Click Save and restart the server.
To deploy perfServletApp.ear:
The performance servlet is deployed exactly as any other servlet. Deploy the servlet on a single application server instance within the domain.
- Open the IBM WAS Admin console.
- Go to Applications on the left-side tree, then navigate to Application Types > WebSphere Enterprise applications.
- Click Install.
- Select Local File system and then browse the perf servlet application ear file.
- Click Next.
- The default path is
<WAS_INSTALLED_PATH>/<APP_SERVER_NAME>/installableApps/PerfServletApp.ear. - Accept all default options and click Next until finish.
- Click Save.
- After successful installation, restart the node server once in order to make the perf servlet work correctly.
- If global security is enabled in Websphere, make sure that a WebSphere Admin User is added to the monitor group of the perfservletApp.
- Navigate to IBM WebSphere Admin console → Applications → Installed Applications → Choose perfservletapp → Security role to user group mapping → Choose Monitor Role → Associate the admin user → Save directly to the master configuration.
Note: To ensure whether the PMI & perfServletApp are configured properly in WebSphere, invoke the below URL & check whether the data is returned in XML format.
http://localhost:<PORT>/wasPerfTool/servlet/perfservlet- 9080 (Default)Refer: Retrieving performance data with PerfServlet for more information.
Hierarchy of IBM WebSphere Application resources
For IBM WebSphere Application:
• IBM WAS Node
• IBM WAS Server
• IBM WAS Application
Supported Metrics
Click here to view the supported metrics
| Native Type | Metric Name | Display Name | Units | Application Version | Description |
|---|---|---|---|---|---|
| IBM WAS Node | ibm_was_resource_APIStats | IBM WAS Resource API Stattistics | count | 1.0.0 | Provides the number of API calls made within the frequency and resources. |
| IBM WAS Server | ibm_was_JdbcCreateCount | IBM WAS JDBC Create Count | count | 1.0.0 | The total number of managed connections that were created since pool creation. |
| ibm_was_JdbcCloseCount | IBM WAS JDBC Close Count | count | 1.0.0 | The total number of managed connections that were destroyed since pool creation. | |
| ibm_was_JdbcAllocateCount | IBM WAS JDBC Allocate Count | count | 1.0.0 | The total number of managed connections that were allocated since pool creation. | |
| ibm_was_JdbcReturnCount | IBM WAS JDBC Return Count | count | 1.0.0 | The total number of managed connections that were returned since pool creation. | |
| ibm_was_JdbcPoolSize | IBM WAS JDBC Pool Size | count | 1.0.0 | The size of the connection pool. | |
| ibm_was_JdbcFreePoolSize | IBM WAS JDBC Free Pool Size | count | 1.0.0 | The number of managed connections that are in the free pool. | |
| ibm_was_JdbcWaitingThreadCount | IBM WAS JDBC Waiting Thread Count | count | 1.0.0 | The number of threads that are currently waiting for a connection. | |
| ibm_was_JdbcFaultCount | IBM WAS JDBC Fault Count | count | 1.0.0 | The total number of faults, such as timeouts, in the connection pool. | |
| ibm_was_JdbcPercentUsed | IBM WAS JDBC Percent Used | % | 1.0.0 | The percent of the pool that is in use. | |
| ibm_was_JdbcUseTime | IBM WAS JDBC Use Time | ms | 1.0.0 | The average time in milliseconds that a connection is in use. Shown as millisecond. | |
| ibm_was_JdbcWaitTime | IBM WAS JDBC Wait Time | ms | 1.0.0 | The average waiting time in milliseconds until a connection is granted if a connection is not currently available. Shown as millisecond | |
| ibm_was_JdbcPrepStmtCacheDiscardCount | IBM WAS JDBC Prep Stmt Cache Discard Count | count | 1.0.0 | The total number of statements that are discarded by the least recently used (LRU) algorithm of the statement cache. | |
| ibm_was_JdbcTime | IBM WAS JDBC Time | ms | 1.0.0 | The average time in milliseconds spent running in the JDBC driver includes time that is spent in the JDBC driver, network, and database. Shown as millisecond. | |
| ibm_was_JvmHeapSize | IBM WAS JVM Heap Size | KB | 1.0.0 | The total memory in the JVM run time. Shown as kibibyte. | |
| ibm_was_JvmFreeMemory | IBM WAS JVM Free Memory | KB | 1.0.0 | The free memory in the JVM run time. Shown as kibibyte. | |
| ibm_was_JvmUsedMemory | IBM WAS JVM Used Memory | KB | 1.0.0 | The used memory in the JVM run time. Shown as kibibyte. | |
| ibm_was_JvmUpTime | IBM WAS JVM Up Time | s | 1.0.0 | The amount of time that the JVM is running. Shown as second. | |
| ibm_was_JvmProcessCpuUsage | IBM WAS JVM Process CPU Usage | % | 1.0.0 | The CPU Usage (in percent) of the Java virtual machine.Shown as percent. | |
| ibm_was_ThreadPoolsActiveCount | IBM WAS Thread Pools Active Count | count | 1.0.0 | The number of concurrently active threads. Shown as thread. | |
| ibm_was_ThreadPoolsSize | IBM WAS Thread Pools Size | count | 1.0.0 | The average number of threads in pool. Shown as thread. | |
| ibm_was_ThreadPoolDeclaredThreadHungCount | IBM WAS Thread Pool Declared Thread Hung Count | count | 1.0.0 | The number of threads declared hung. Shown as thread. | |
| ibm_was_ThreadPoolClearedThreadHangCount | IBM WAS Thread Pool Cleared ThreadHang Count | count | 1.0.0 | The number of thread hangs cleared. Shown as thread. | |
| ibm_was_ThreadPoolConcurrentHungThreadCount | IBM WAS Thread Pool Concurrent Hung Thread Count | count | 1.0.0 | The number of concurrently hung threads. Shown as thread. | |
| ibm_was_OverallCPUUtilization | IBM WAS Overall CPU Utilization | % | 1.0.0 | IBM WAS Overall CPU Utilization. | |
| ibm_was_TotalMemory | IBM WAS Total Memory | KB | 1.0.0 | IBM WAS Total Memory. | |
| ibm_was_RecentCPUUtilization | IBM WAS Recent CPU Utilization | % | 1.0.0 | IBM WAS Recent CPU Utilization. | |
| ibm_was_ResidentMemory | IBM WAS Resident Memory | KB | 1.0.0 | IBM WAS Resident Memory. | |
| IBM WAS Application | ibm_was_ServletSessionLifeTime | IBM WAS Servlet Session Life Time | ms | 1.0.0 | The average session life time in milliseconds (time invalidated - time created) |
| ibm_was_ServletSessionLiveCount | IBM WAS Servlet Session Live Count | count | 1.0.0 | The number of local sessions that are currently cached in memory from the time at which this metric is enabled. Shown as session. | |
| ibm_was_ServletSessionNoRoomForNewSessionCount | IBM WAS Servlet Session No Room For New Session Count | count | 1.0.0 | Applies only to sessions in memory with AllowOverflow=false. The number of times that a request for a new session cannot be handled because it exceeds the maximum session count. | |
| ibm_was_ServletSessionExternalReadTime | IBM WAS Servlet Session External Read Time | ms | 1.0.0 | The time (ms) taken in reading the session data from the persistent store. For multirow sessions, the metrics are for the attribute; for single row sessions, the metrics are for the entire session. Applicable only for persistent sessions. When using a JMS persistent store, only available if replicated data is serialized. | |
| ibm_was_ServletSessionExternalReadSize | IBM WAS Servlet Session External Read Size | Bytes | 1.0.0 | Size of the session data read from persistent store. Applicable only for (serialized) persistent sessions; similar to external Read Time. | |
| ibm_was_ServletSessionExternalWriteTime | IBM WAS Servlet Session External Write Time | ms | 1.0.0 | The time (milliseconds) taken to write the session data from the persistent store. Applicable only for (serialized) persistent sessions. Similar to external Read Time. | |
| ibm_was_ServletSessionExternalWriteSize | IBM WAS Servlet Session External Write Size | Bytes | 1.0.0 | The size of the session data written to the persistent store. Applicable only for (serialized) persistent sessions. Similar to external Read Time. | |
| ibm_was_ServletSessionActiveCount | IBM WAS Servlet Session Active Count | count | 1.0.0 | The number of concurrently active sessions. A session is active if the WebSphere Application Server is currently processing a request that uses that session. | |
| ibm_was_webapp_RequestCount | IBM WAS WebApp Request Count | count | 1.0.0 | The total number of requests that a web application processed. | |
| ibm_was_webapp_ConcurrentRequests | IBM WAS WebApp Concurrent Requests | count | 1.0.0 | The number of requests that are concurrently processed. | |
| ibm_was_webapp_ServiceTime | IBM WAS WebApp Service Time | ms | 1.0.0 | IBM WAS WebApp Service Time. | |
| ibm_was_webapp_ErrorCount | IBM WAS WebApp Error Count | count | 1.0.0 | Total number of errors in a servlet or JavaServer Page (JSP). | |
| ibm_was_webapp_AsyncContextResponseTime | IBM WAS WebApp Async Context Response Time | ms | 1.0.0 | IBM WAS WebApp Async Context Response Time. |
Default Monitoring Configurations
IBM Websphere Application Server has default Global Device Management Policies, Global Templates, Global Monitors and Global metrics in OpsRamp. Users can customize these default monitoring configurations as per their business use cases by cloning respective global templates and global Device Management Policies. OpsRamp recommends doing this activity before installing the app to avoid noise alerts and data.
Default Global Device Management Policies
OpsRamp has a Global Device Management Policy for each Native Type of IBM Websphere Application Server. You can find those Device Management Policies at Setup > Resources > Device Management Policies, search with suggested names in global scope. Each Device Management Policy follows below naming convention:
{appName nativeType - version}Ex: ibm-websphere IBM WAS Server - 1(i.e, appName = ibm-websphere, nativeType = IBM WAS Server , version = 1)
Default Global Templates
OpsRamp has a Global template for each Native Type of IBM Websphere Application Server. You can find those templates at Setup > Monitoring > Templates, search with suggested names in global scope. Each template follows below naming convention:
{appName nativeType 'Template' - version}Ex: ibm-websphere IBM WAS Server Template- 1(i.e, appName = ibm-websphere, nativeType = IBM WAS Server, version = 1)
Default Global Monitors
OpsRamp has a Global Monitors for each Native Type which has monitoring support. You can find those monitors at Setup > Monitoring > Monitors, search with suggested names in global scope. Each Monitors follows below naming convention:
{monitorKey appName nativeType - version}Ex: IBM WAS Application Monitor ibm-websphere IBM WAS Server 1 (i.e, monitorKey = IBM WAS Application Monitor, appName = ibm-websphere, nativeType =IBM WAS Server,version = 1)
Configure and Install the IBM WAS Integration
- From All Clients, select a client.
- Go to Setup > Account.
- Select the Integrations and Apps tab.
- The Installed Integrations page, where all the installed applications are displayed.
Note: If there are no installed applications, it will navigate to the ADD APP page. - Click + ADD on the Installed Integrations page. The Available Integrations and Apps page displays all the available applications along with the newly created application with the version.
Note: You can even search for the application using the search option available. Also you can use the All Categories option to search.
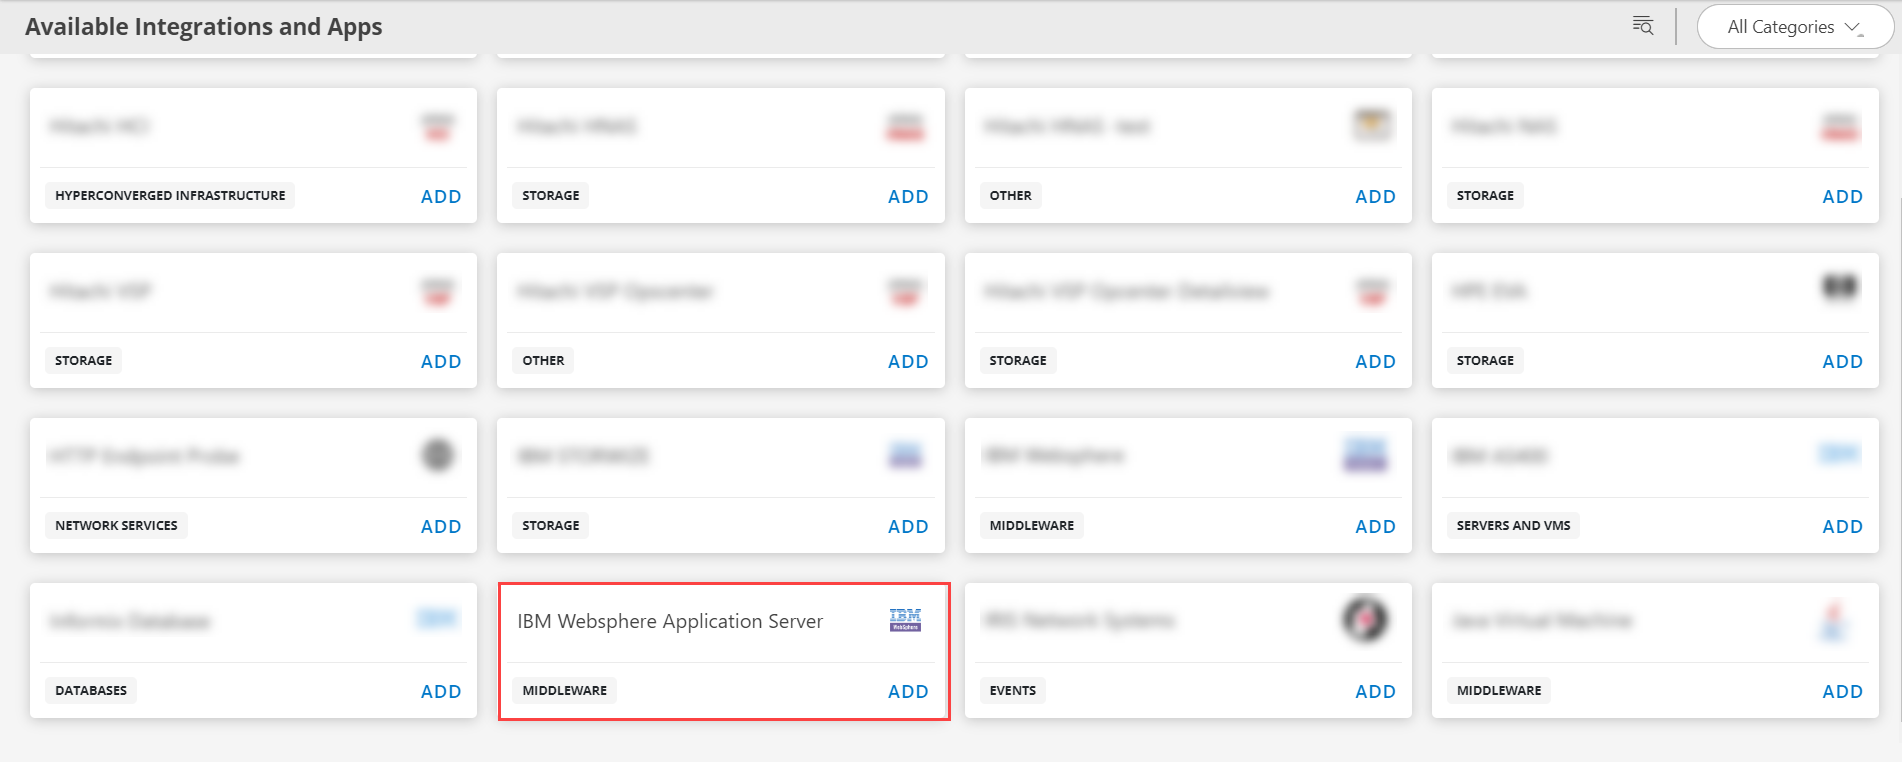
- Click ADD in the IBM Websphere Application Server application.
Note: Select the version from the drop down menu. - In the Configurations page, click + ADD. The Add Configuration page appears.
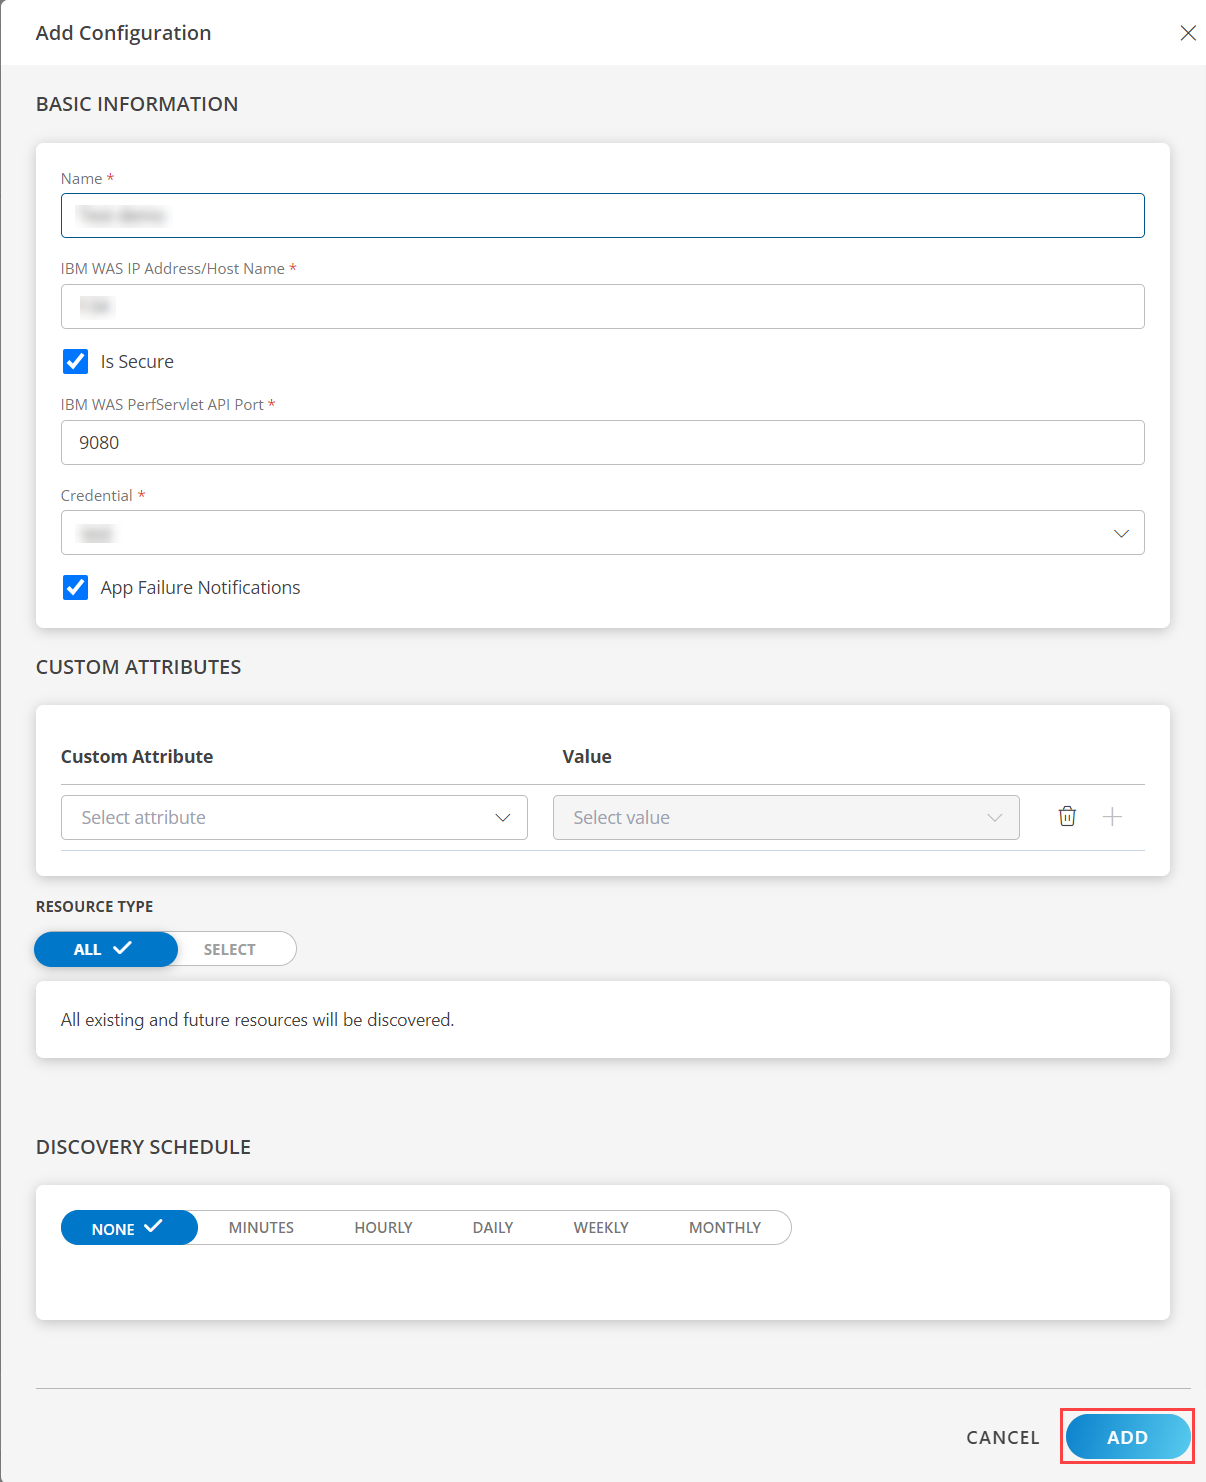
- Enter the below mentioned Basic Information:
| Functionality | Description |
|---|---|
| Name | Enter the name for the configuration. |
| IBM WAS IP Address/Host Name | IP address/host name of the IBM WAS. |
| IBM WAS PerfServlet API Port | API Port details Example: Default port value is 9080. |
| Credential | Select the Credential from the drop-down list. (Optional): Click + Add to create a credential. The ADD CREDENTIAL window is displayed. Enter the following information.
|
Notes:
- By default the Is Secure checkbox is selected.
- Host Name/IP Address and Port should be accessible from Gateway.
- Select the following:
- App Failure Notifications: if turned on, you will be notified in case of an application failure that is, Connectivity Exception, Authentication Exception.
- Select the below mentioned Custom Attribute:
| Functionality | Description |
|---|---|
| Custom Attribute | Select the custom attribute from the drop down list box. |
| Value | Select the value from the drop down list box. |
Note: The custom attribute that you add here will be assigned to all the resources that are created by the integration. You can add a maximum of five custom attributes (key and value pair).
In the RESOURCE TYPE section, select:
- ALL: All the existing and future resources will be discovered.
- SELECT: You can select one or multiple resources to be discovered.
In the DISCOVERY SCHEDULE section, select Recurrence Pattern to add one of the following patterns:
- Minutes
- Hourly
- Daily
- Weekly
- Monthly
Click ADD.
Now the configuration is saved and displayed on the configurations page after you save it.
Note: From the same page, you may Edit and Remove the created configuration.
Under the ADVANCED SETTINGS, Select the Bypass Resource Reconciliation option, if you wish to bypass resource reconciliation when encountering the same resources discovered by multiple applications.
Note: If two different applications provide identical discovery attributes, two separate resources will be generated with those respective attributes from the individual discoveries.
Click NEXT.
(Optional) Click +ADD to create a new collector by providing a name or use the pre-populated name.
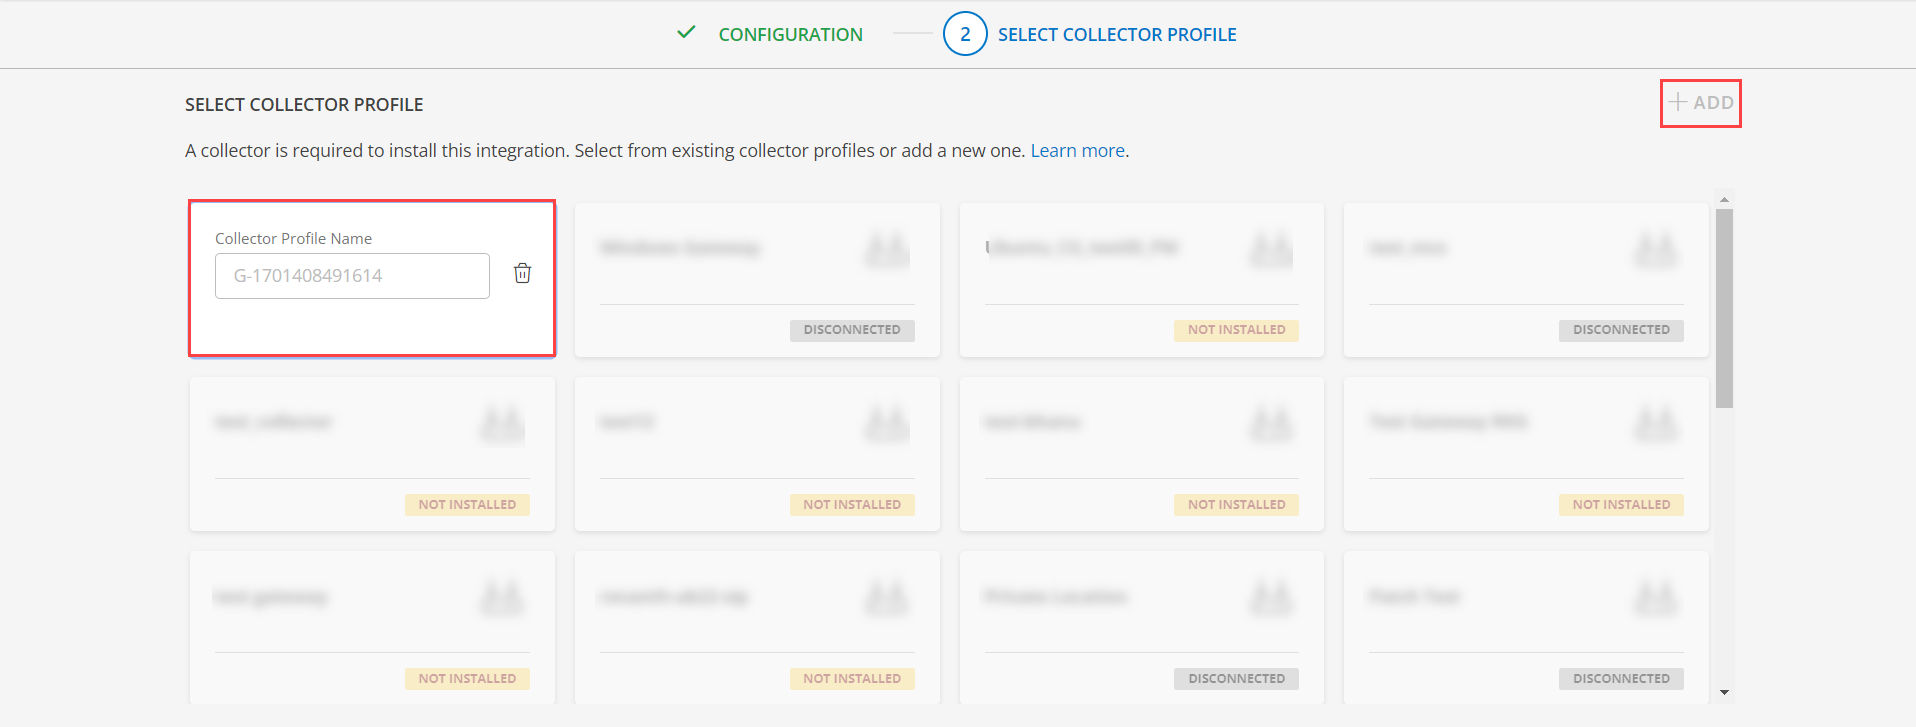
- Select an existing registered profile.
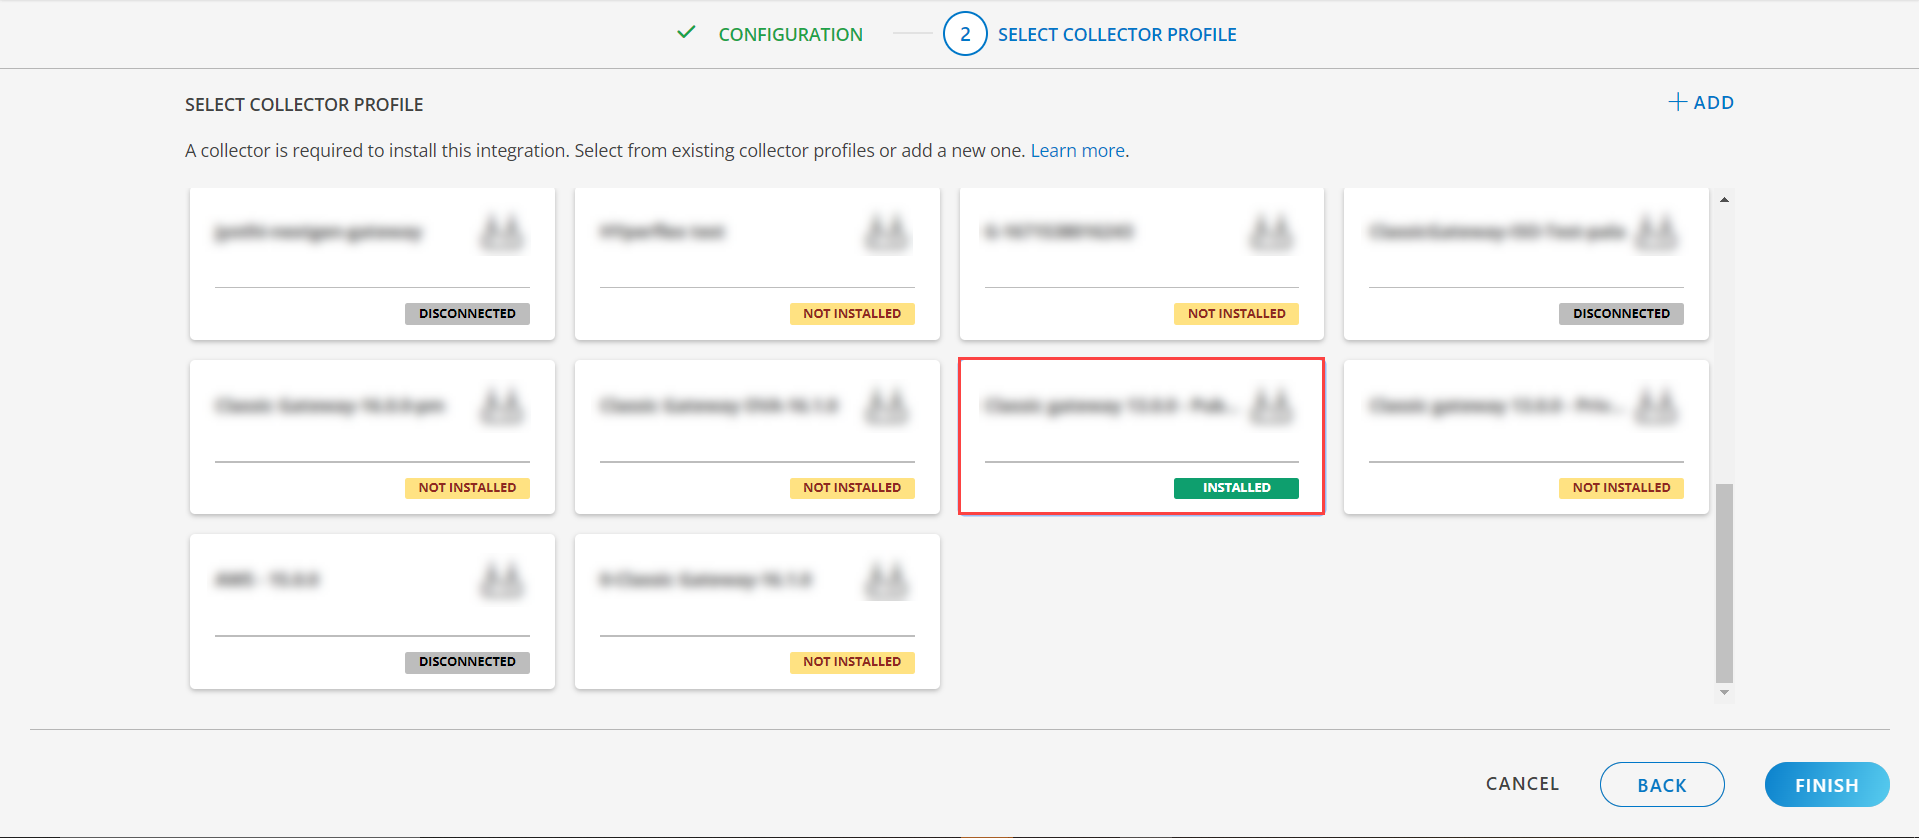
- Click FINISH.
The application is installed and displayed on the INSTALLED INTEGRATION page. Use the search field to find the installed integration.
Modify the Configuration
See Modify an Installed Integration or Application article.
Note: Select the IBM WebSphere Application application.
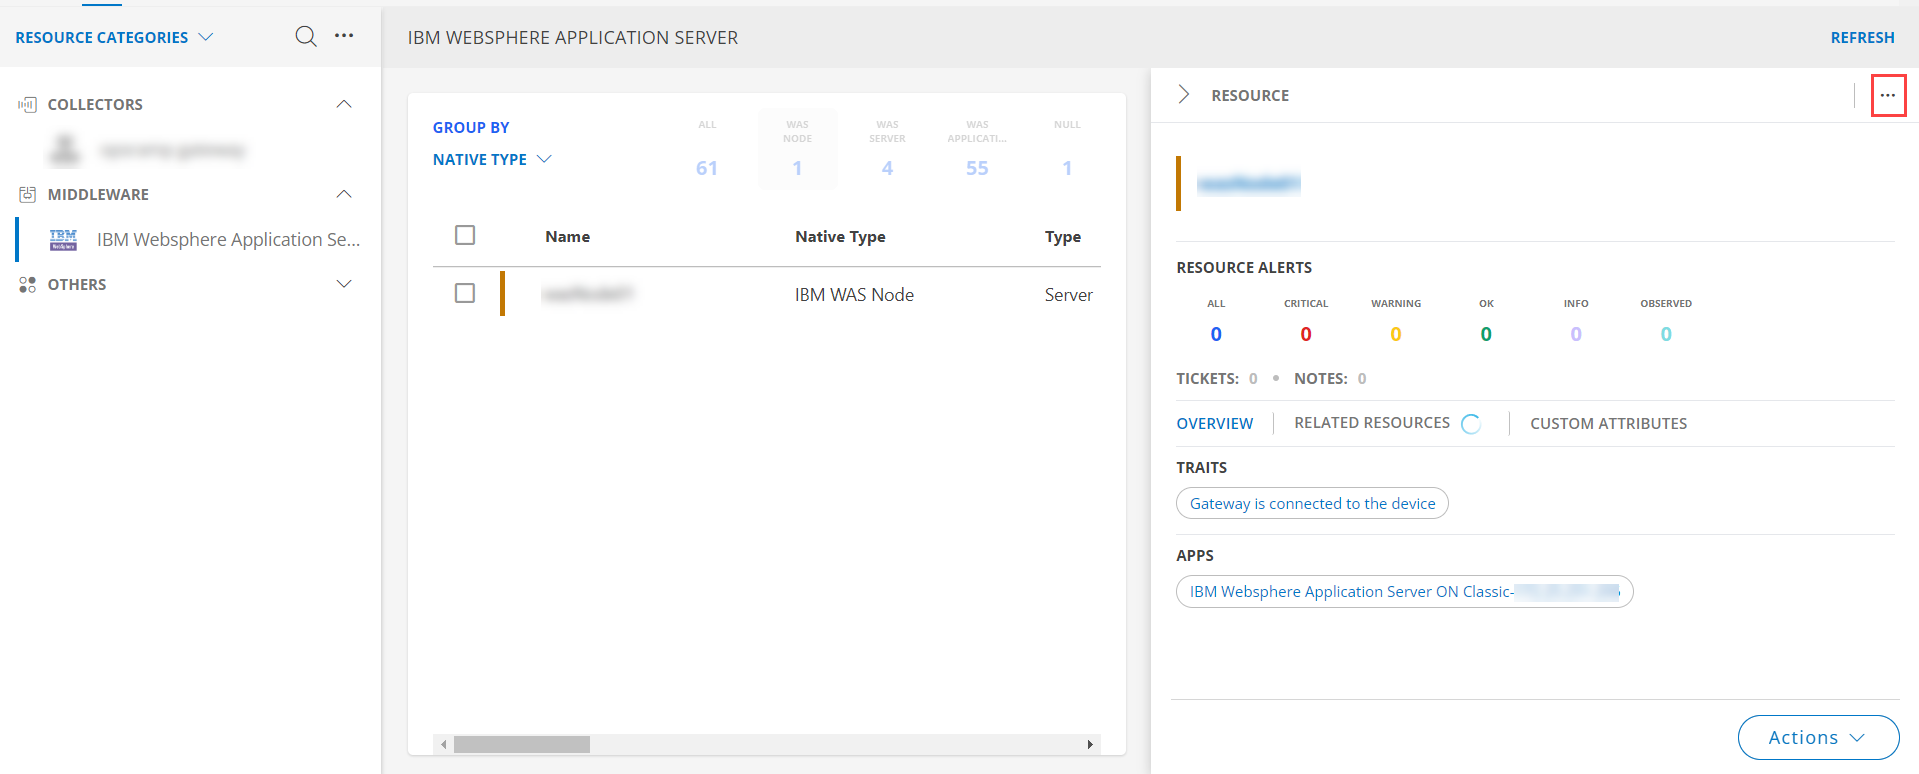
View the IBM Websphere Application Server Details
- Navigate to Infrastructure > Search > MIDDLEWARE > IBM Websphere Application Server.
- The IBM Websphere Application Server page is displayed, select the application name.
- The RESOURCE DETAILS page appears from the right.
- Click the ellipsis (…) on the top right and select View details.
- Navigate to the Attributes tab to view the discovery details.
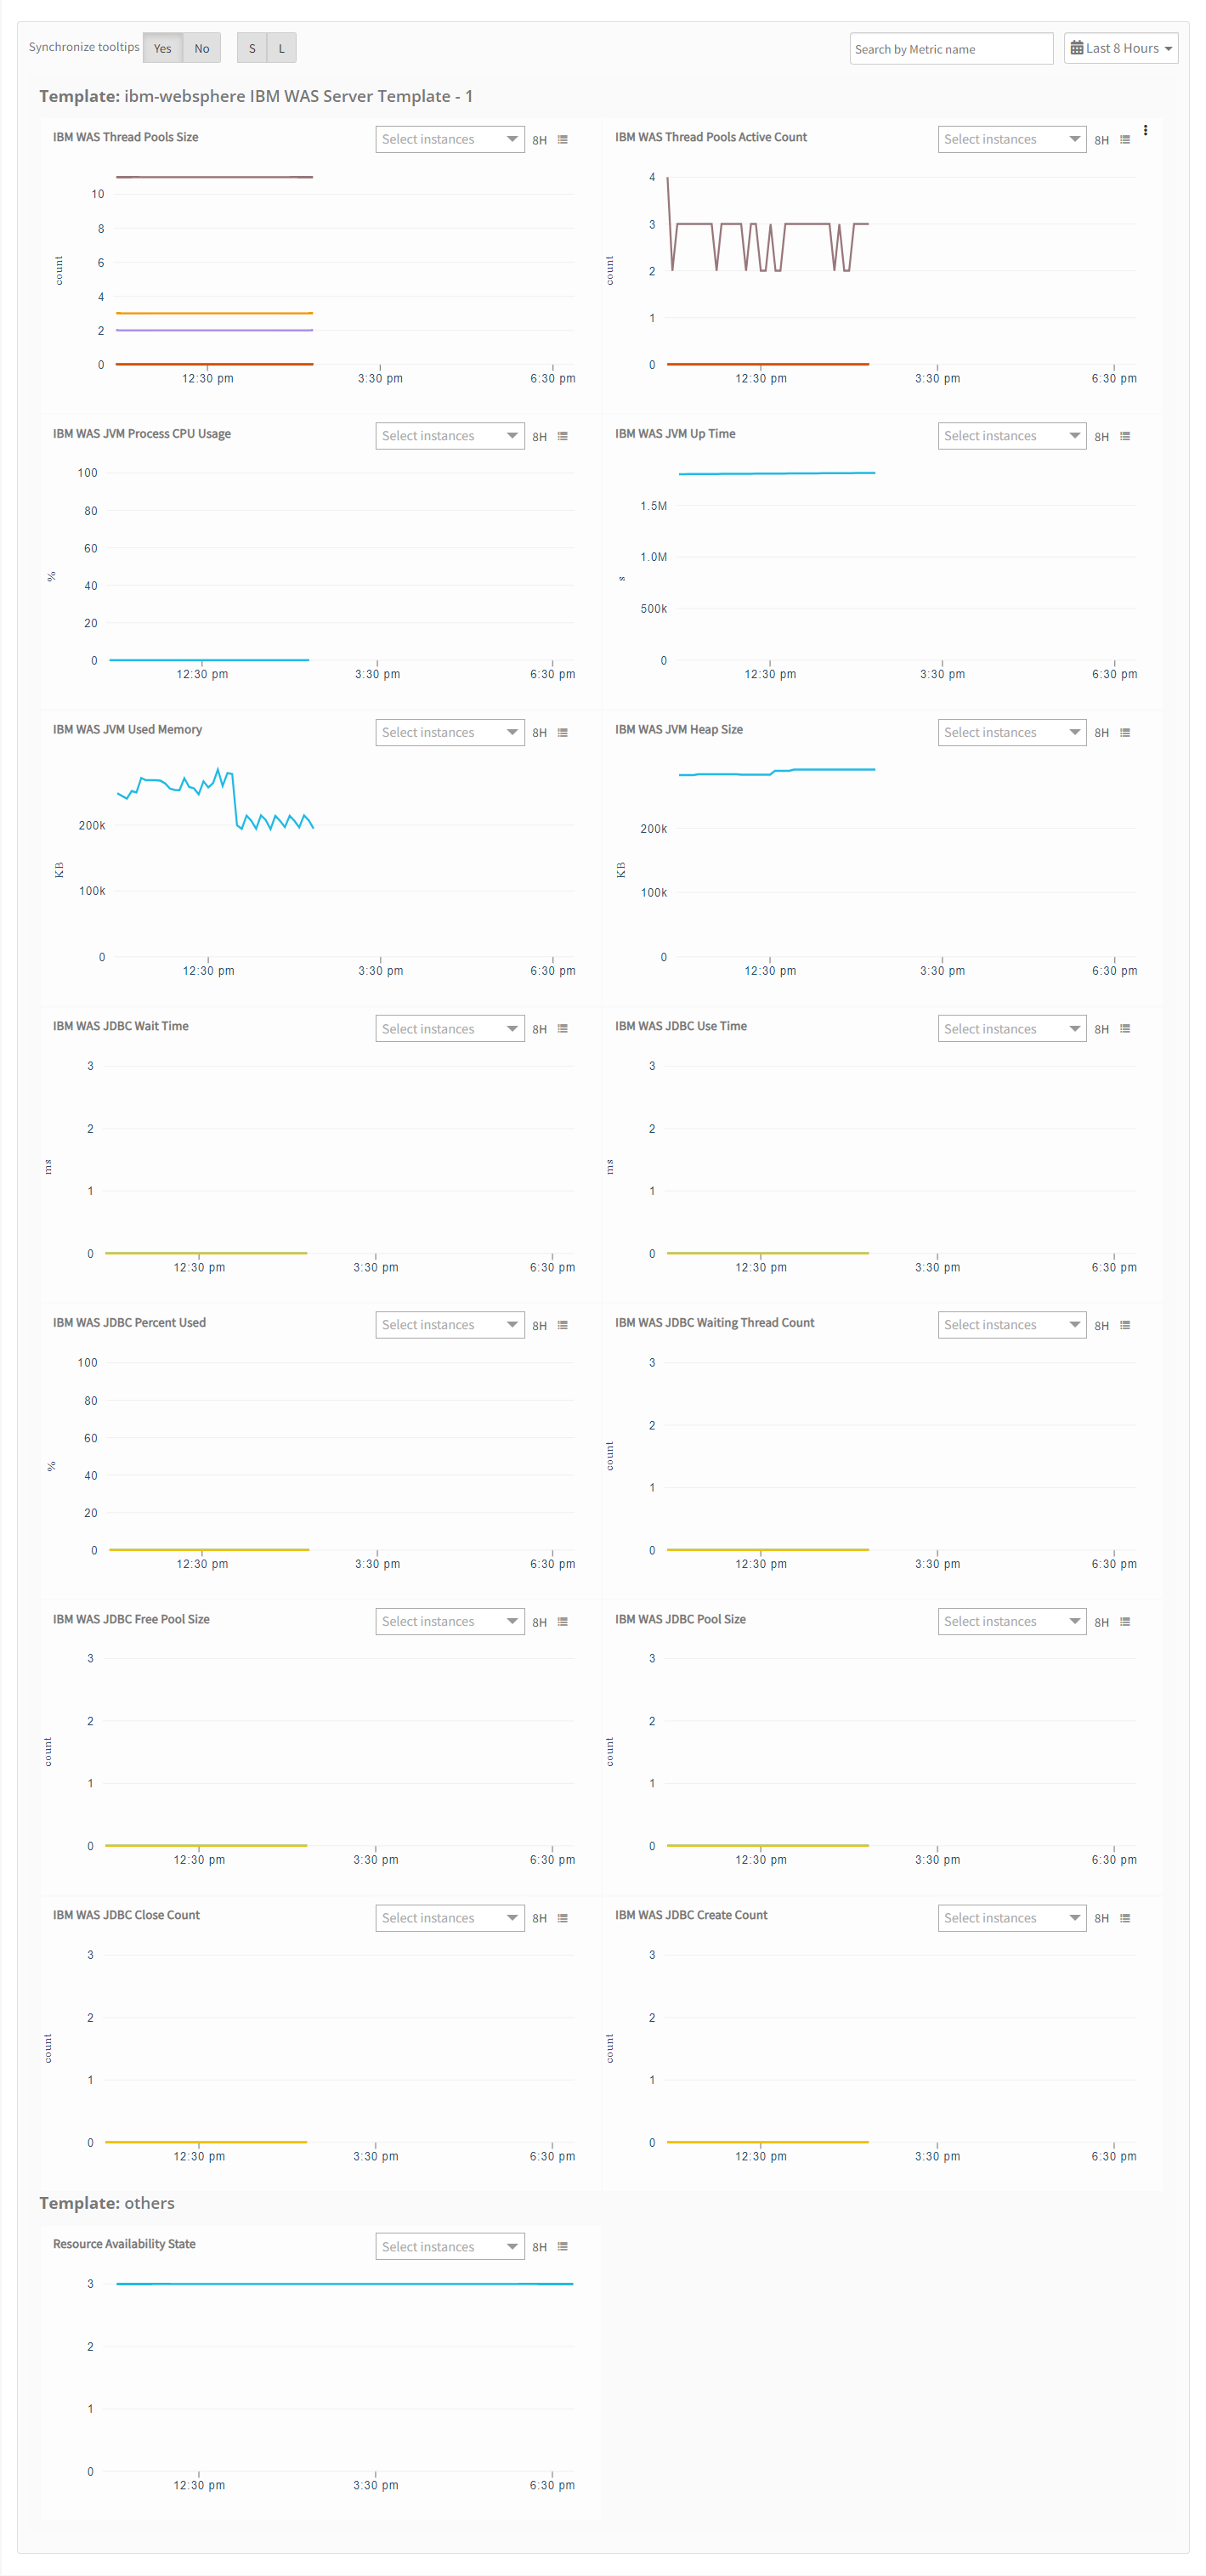
- Click the Metrics tab to view the metric details for IBM Websphere Application Server.
Resource Filter Input Keys
IBM Websphere Application Server application Resources are filtered and discovered based on below keys:
Click here to view the Supported Input Keys
| Resource Type | Supported Input Keys |
|---|---|
| All Types | resourceName |
| hostName | |
| aliasName | |
| dnsName | |
| ipAddress | |
| macAddress | |
| os | |
| make | |
| model | |
| serialNumber | |
| IBM WAS Node | Node Address |
| Version |
Supported Alert Custom Macros
Customize the alert subject and description with below macros then it will generate alert based on customisation
Supported macros keys:
Click here to view the alert subject and description with macros
${resource.name}
${resource.ip}
${resource.mac}
${resource.os}
${resource.type}
${resource.make}
${resource.model}
${resource.serialnumber}
${resource.systemId}
${parent.resource.name}
${Custom attributes on the resource}
Risks, Limitations & Assumptions
- Application can handle Critical/Recovery failure alert notifications for below two cases when user enables App Failure Notifications in configuration
- Connectivity Exception
- Authentication Exception
- Application cannot control monitoring pause/resume actions based on above alerts. Metrics can be used to monitor PowerMax resources and can generate alerts based on the threshold values.
- Component level thresholds can be configured on each resource level.
- No support of showing activity log and applied time.
- Application will send any duplicate/repeat failure alert notification for every 6 hours.
- Latest snapshot metric is available from Gateway version 14.0.0.
- This application supports both Classic Gateway and NextGen Gateway.