Alternative IP Ping Monitoring enables you to monitor the availability and performance of network devices using additional IP addresses beyond the primary device IP address. This feature is particularly useful when devices have multiple network interfaces, redundant network paths, or backup connectivity routes that require independent monitoring.The Alternative IP Ping monitor performs ICMP (Internet Control Message Protocol) ping tests against configured alternative IP addresses and reports reachability status and response metrics for each monitored IP address.
Pre-requisites
- Mapping a gateway management profile to the resource/device is required.
- Allow ICMP between configured IP addresses on the device and the OpsRamp Gateway.
- Ensure the Gateway is running version 22.0.0 or later.
- Ensure the Platform is running version 2026.07-U1 or later.
- The required monitoring template must be available in the system before assigning it to a device.
Apply Alternative IP Ping Monitoring on the Device
To apply Alternative IP Ping Monitoring:
- From All Clients, select a client.
- Go to Infrastructure > Search.
- From the available resources, select the required resource.
- Select the Metrics tab. Click the View Metrics Configuration icon (slider/settings icon) in the top-right corner.
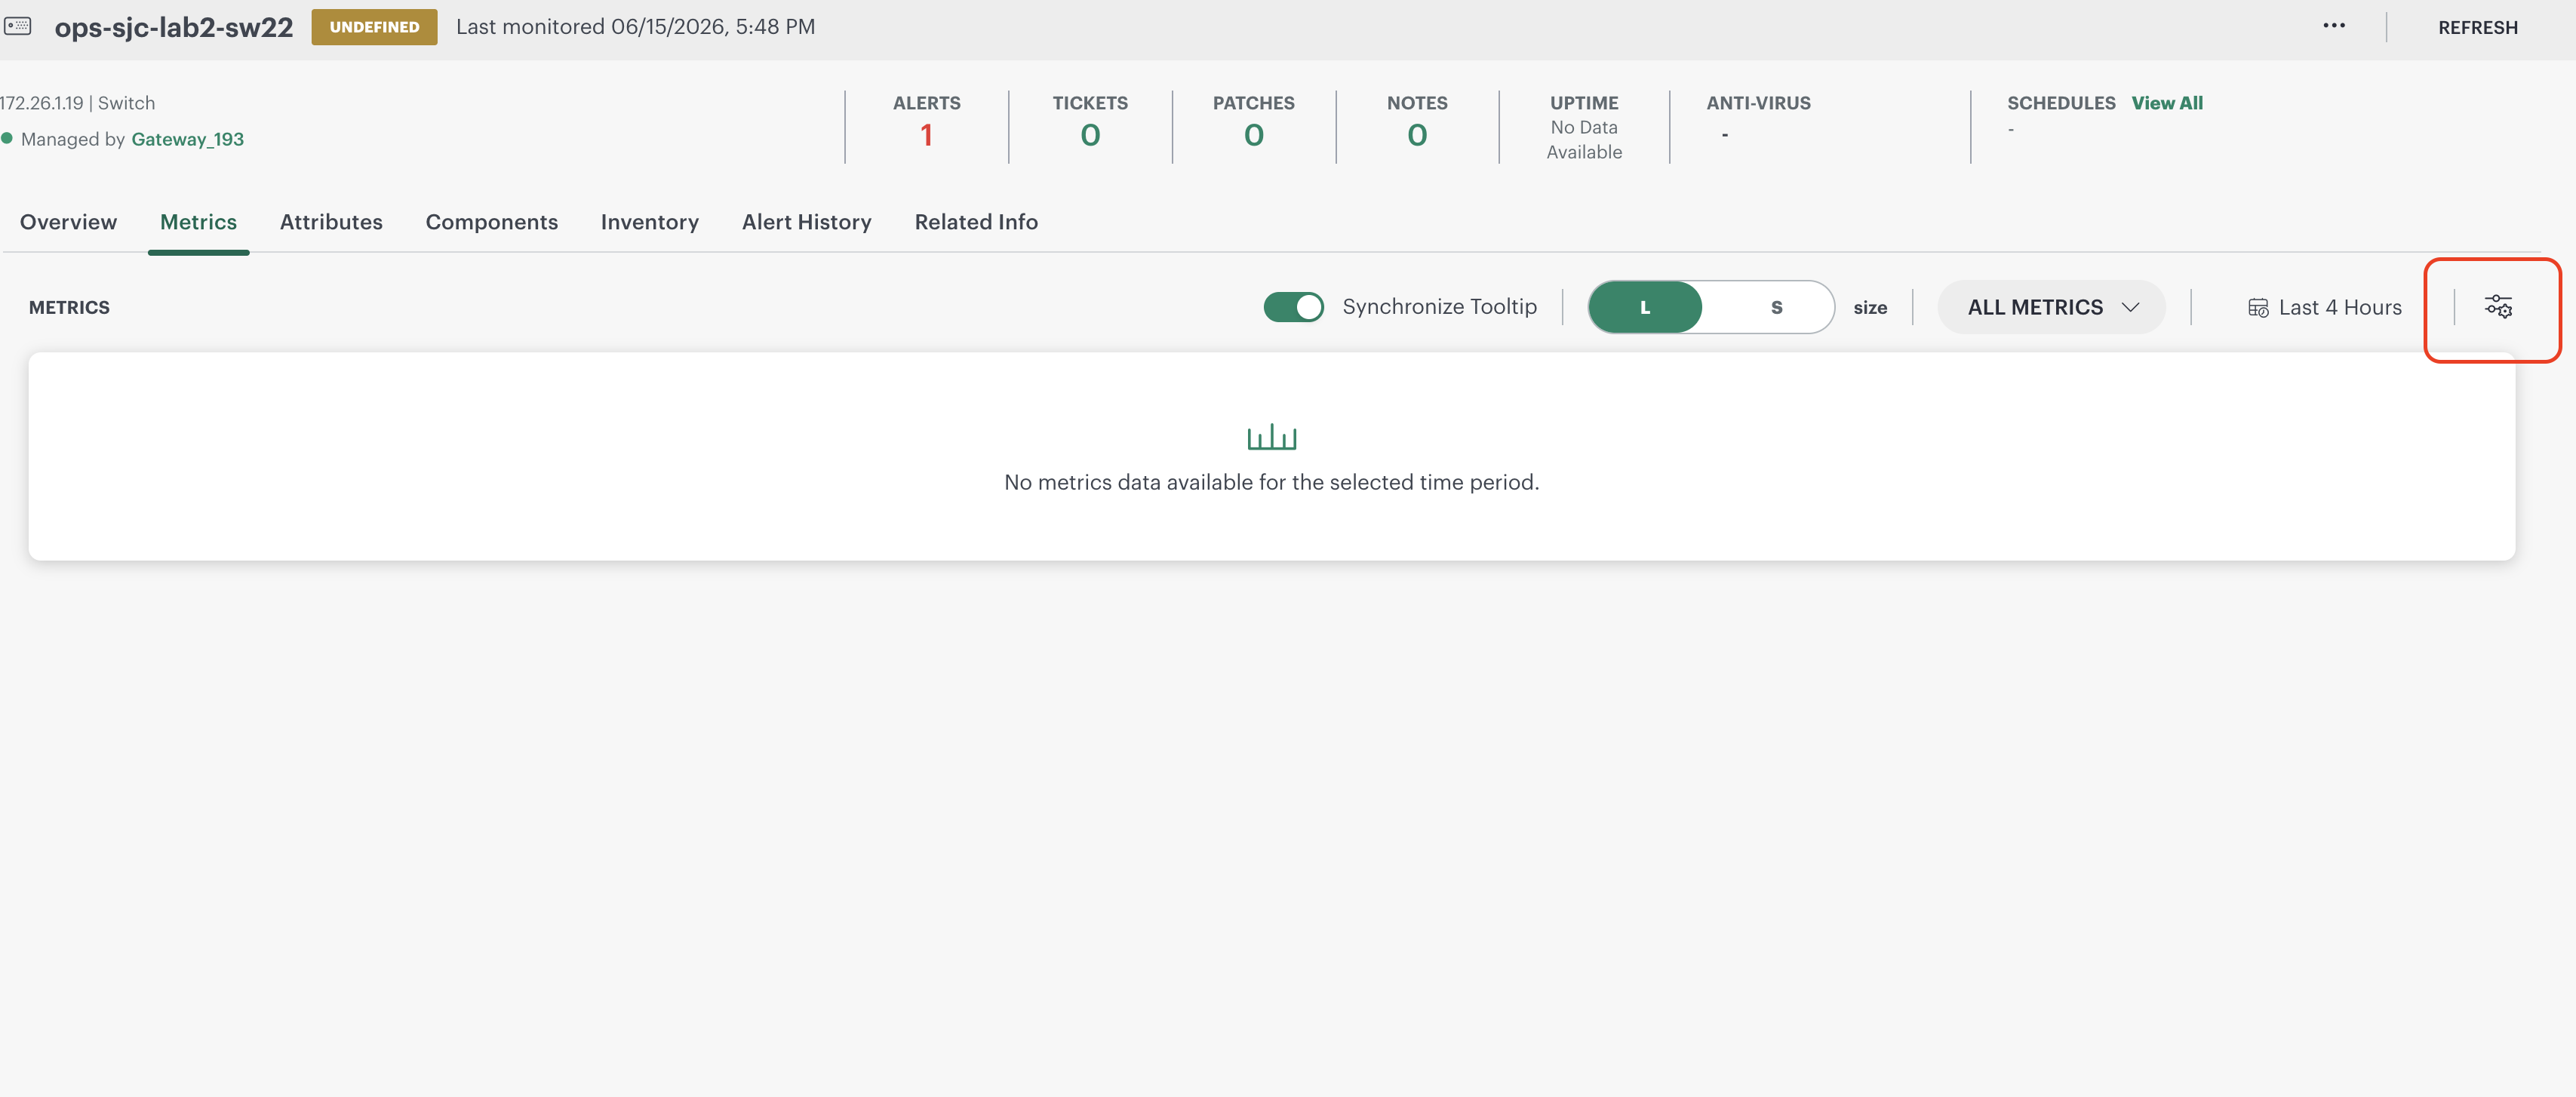
- You will be redirected to the Metric Configuration page for the selected device.
- Navigate to the Assigned Templates tab.
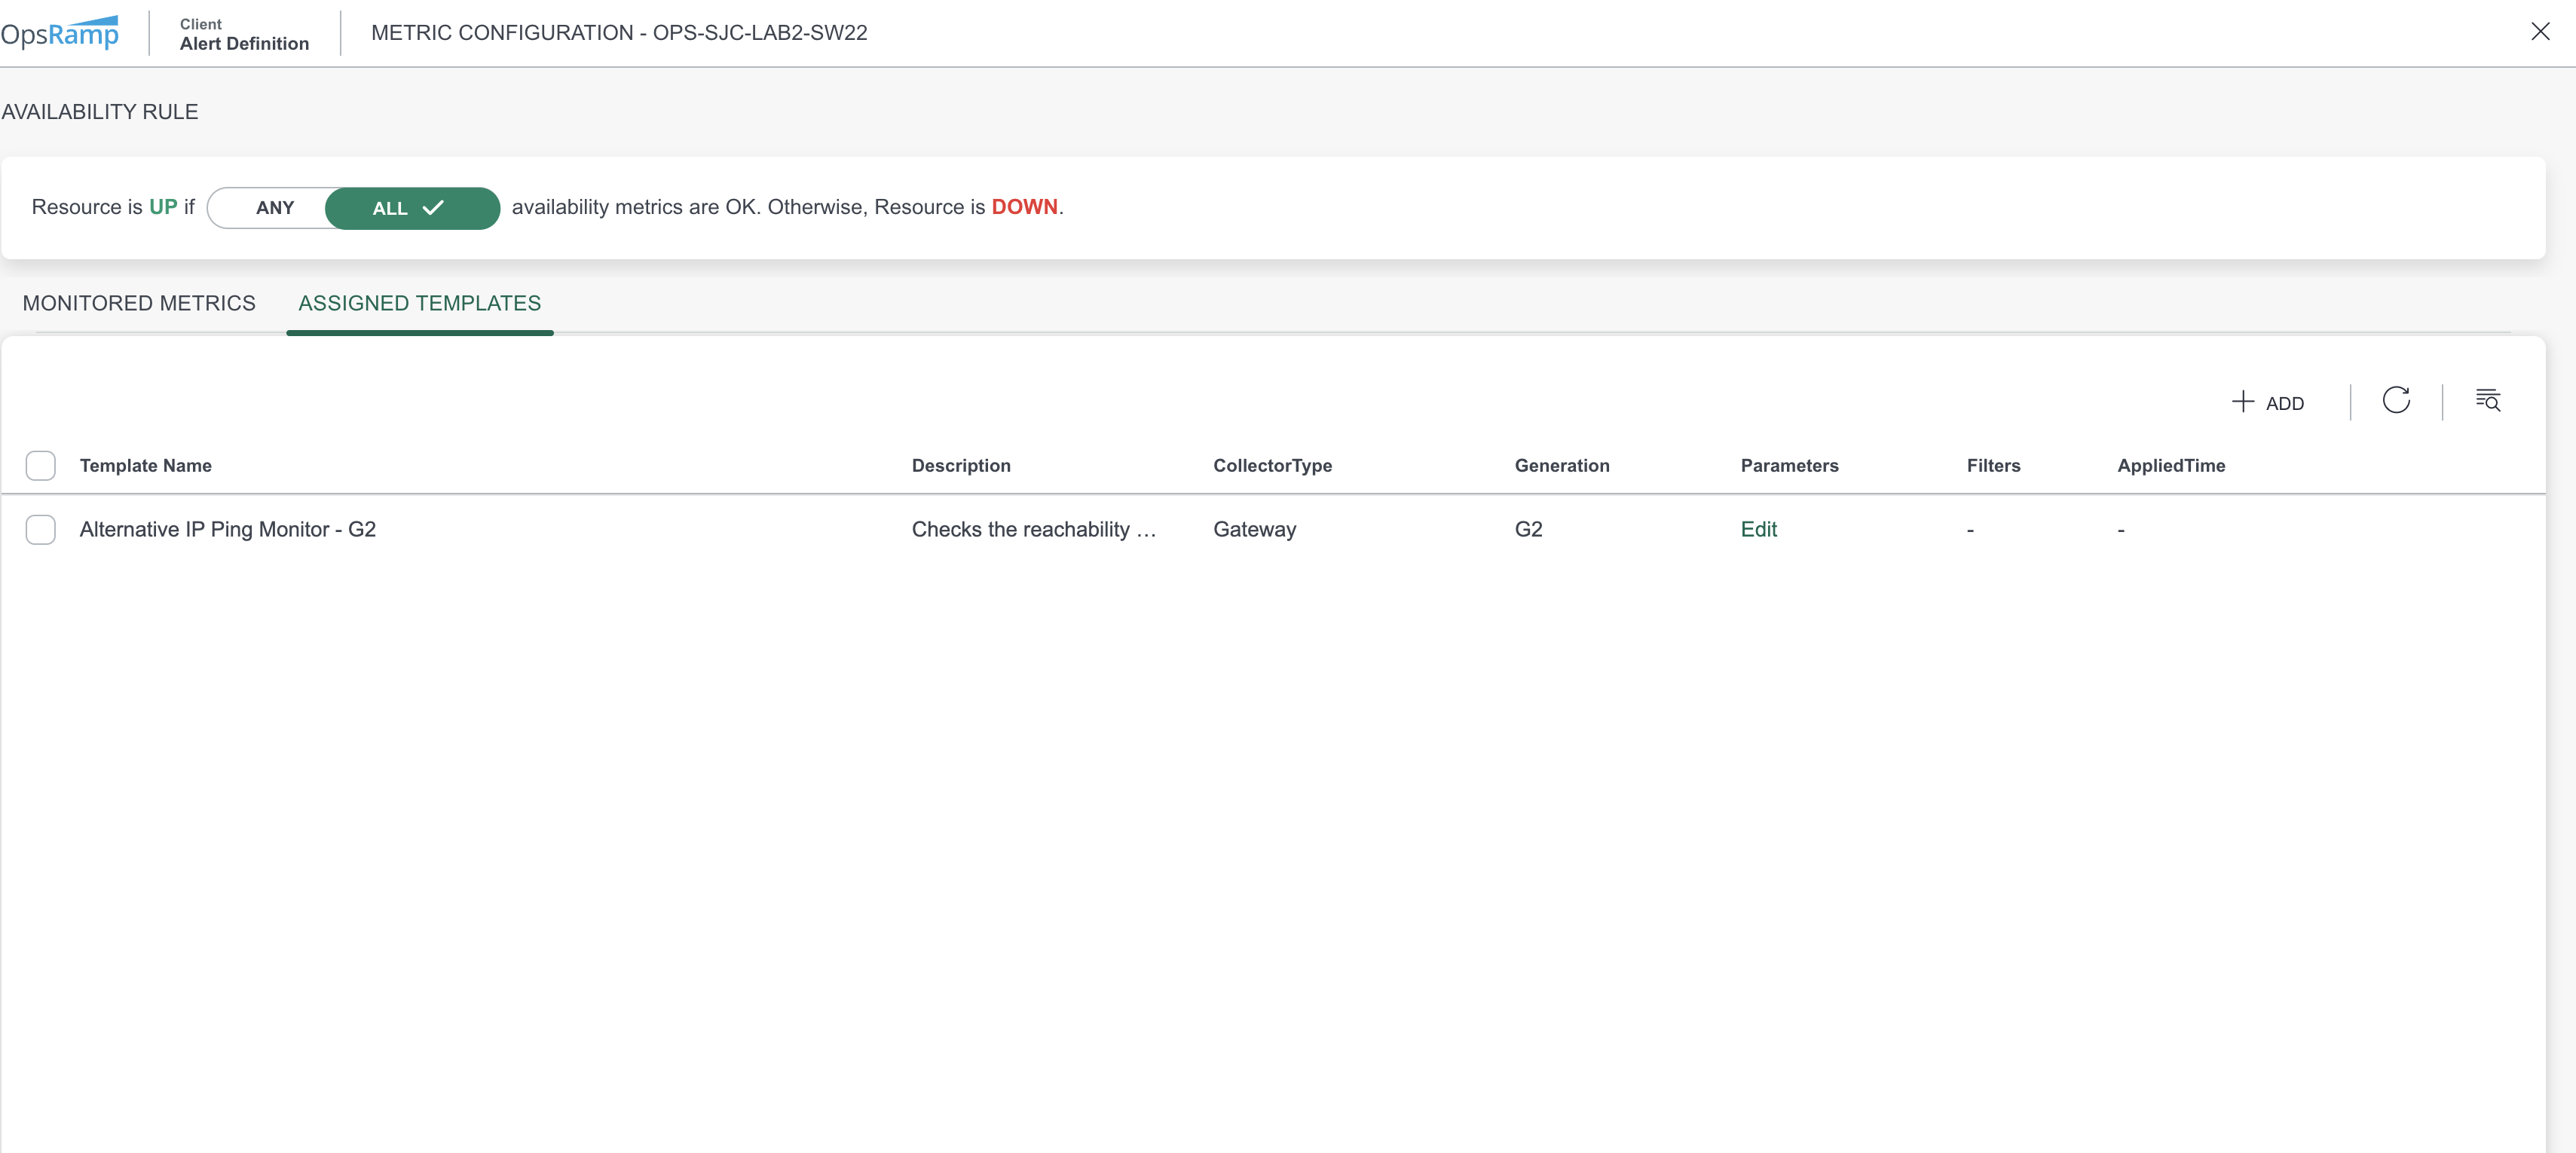
- Click + Add in the upper-right corner to assign a monitoring template to the selected device.
- In the Assign Template pop-up, search for the required template by entering the Template Name.
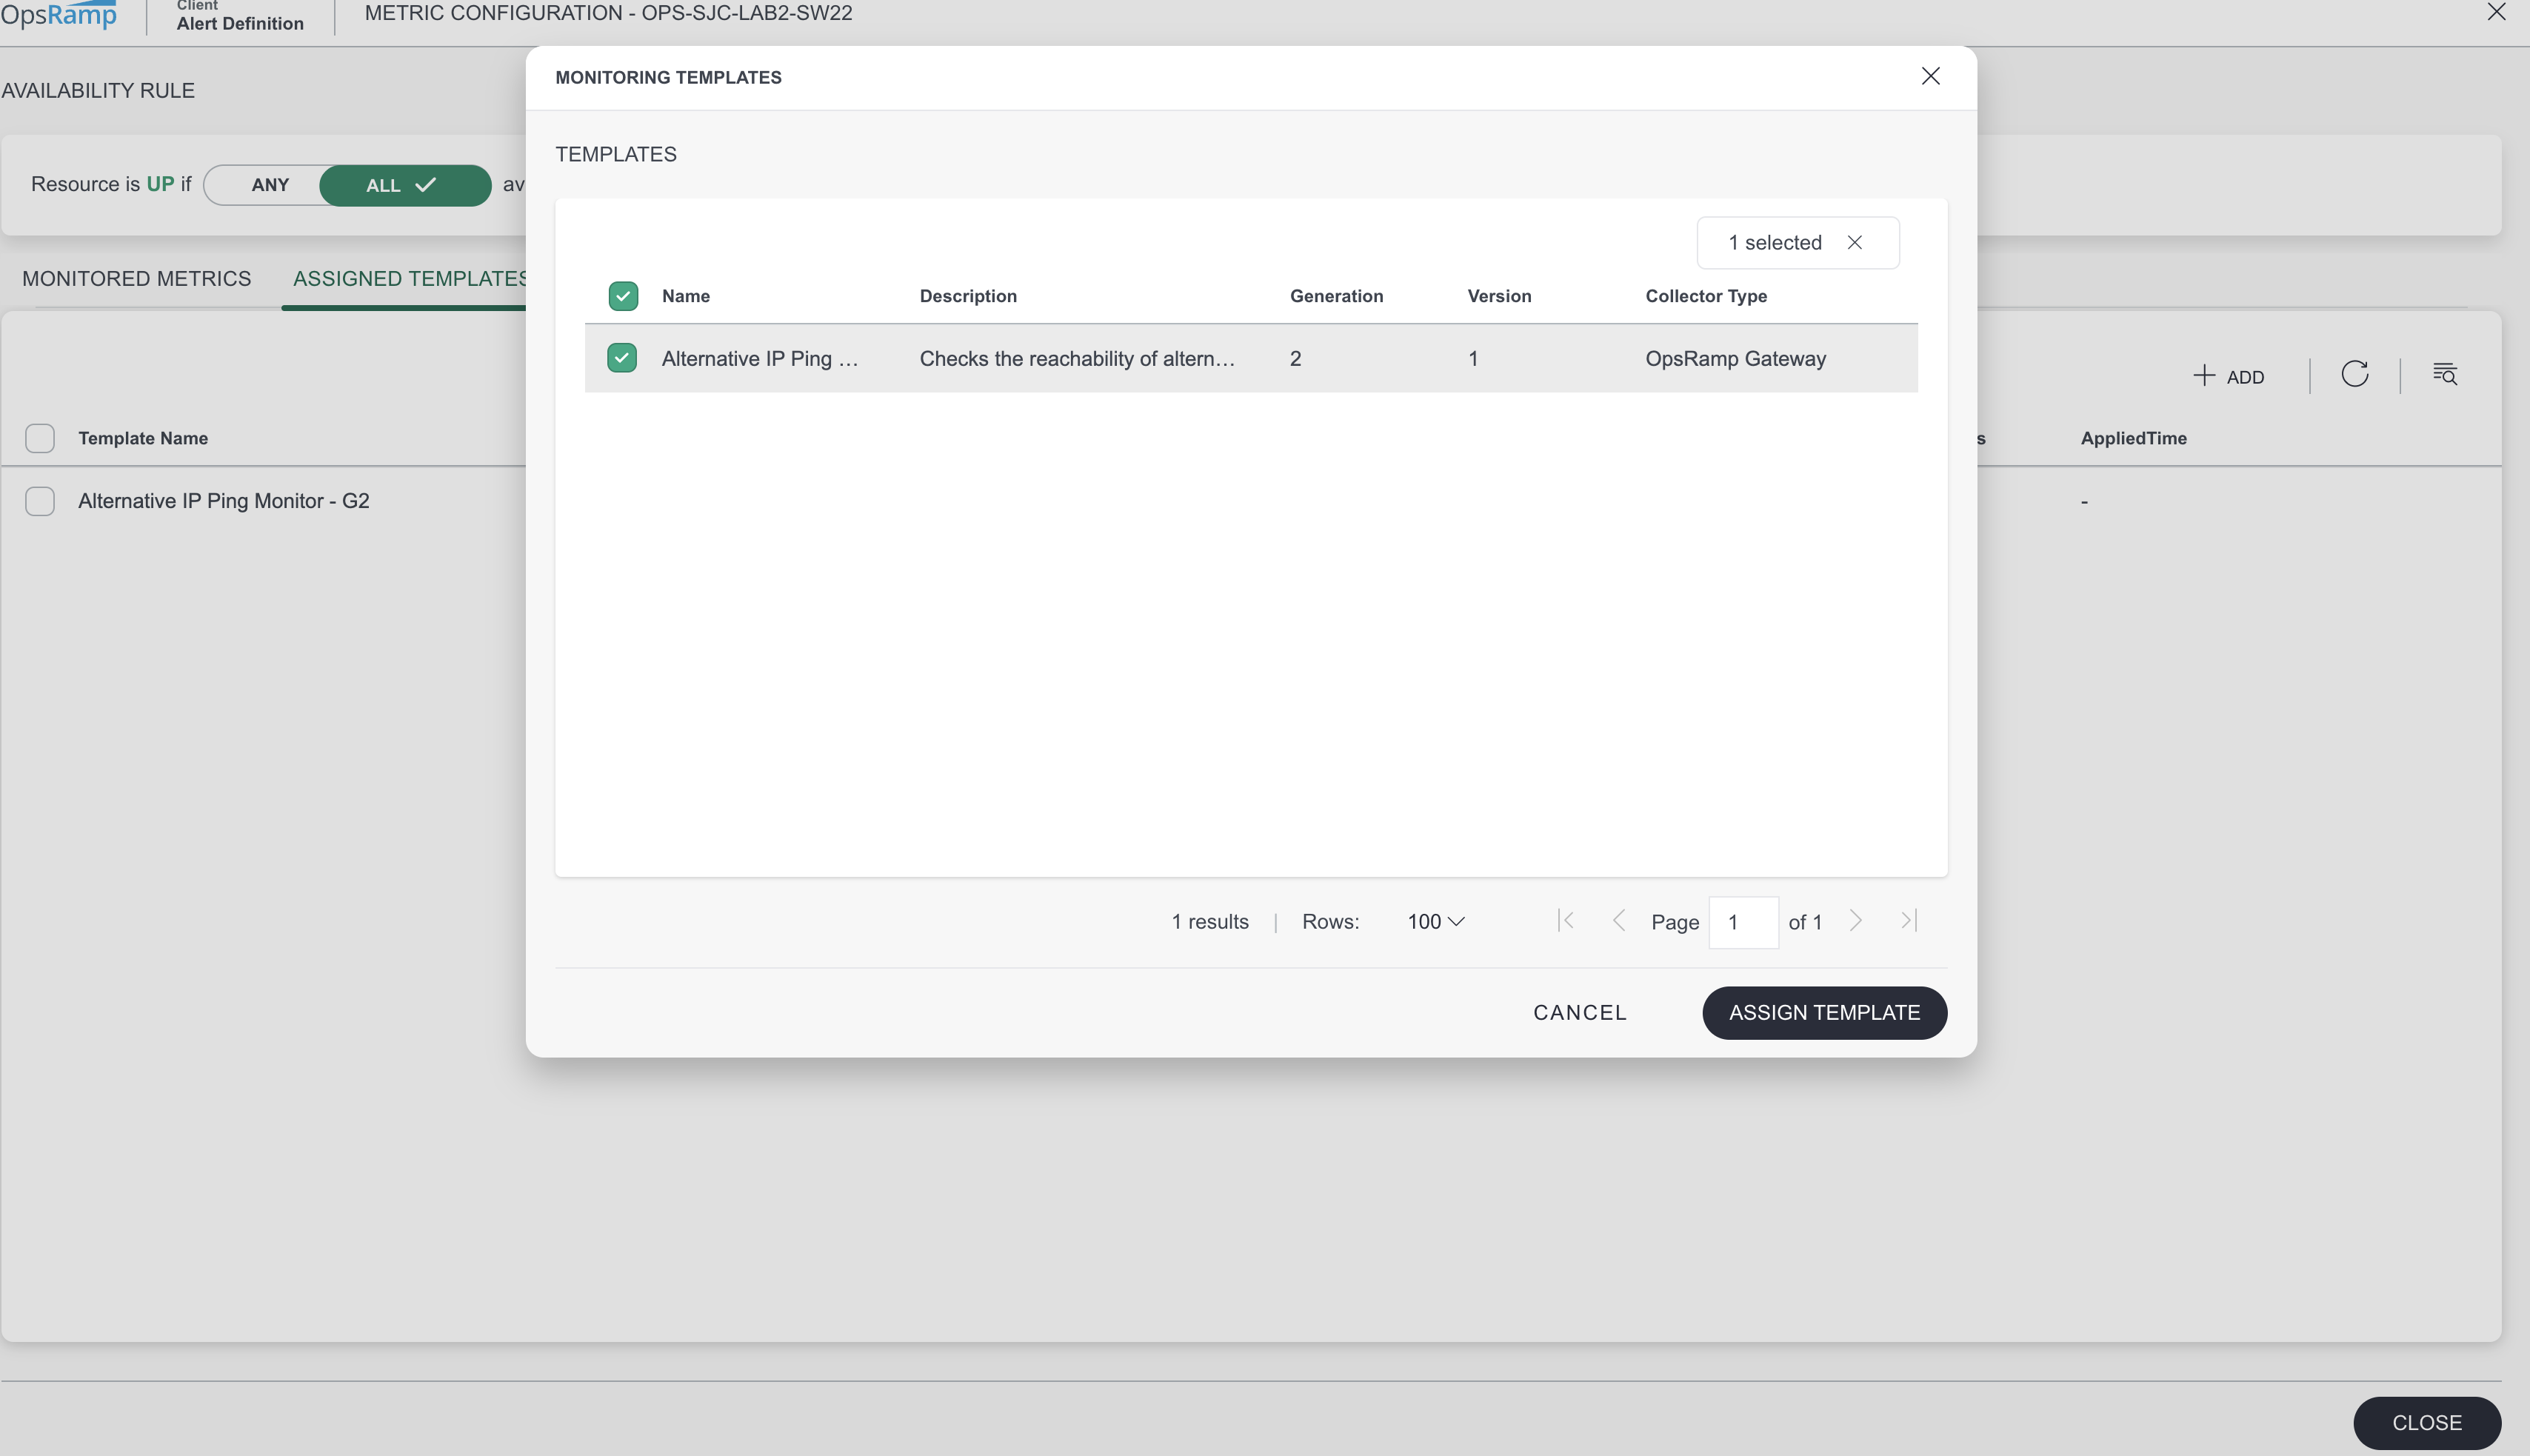
- Select the required template from the search results. Click Assign Template to associate the selected template with the device.
- The Configuration Parameters screen is displayed. Modify the required configuration parameter values as needed.
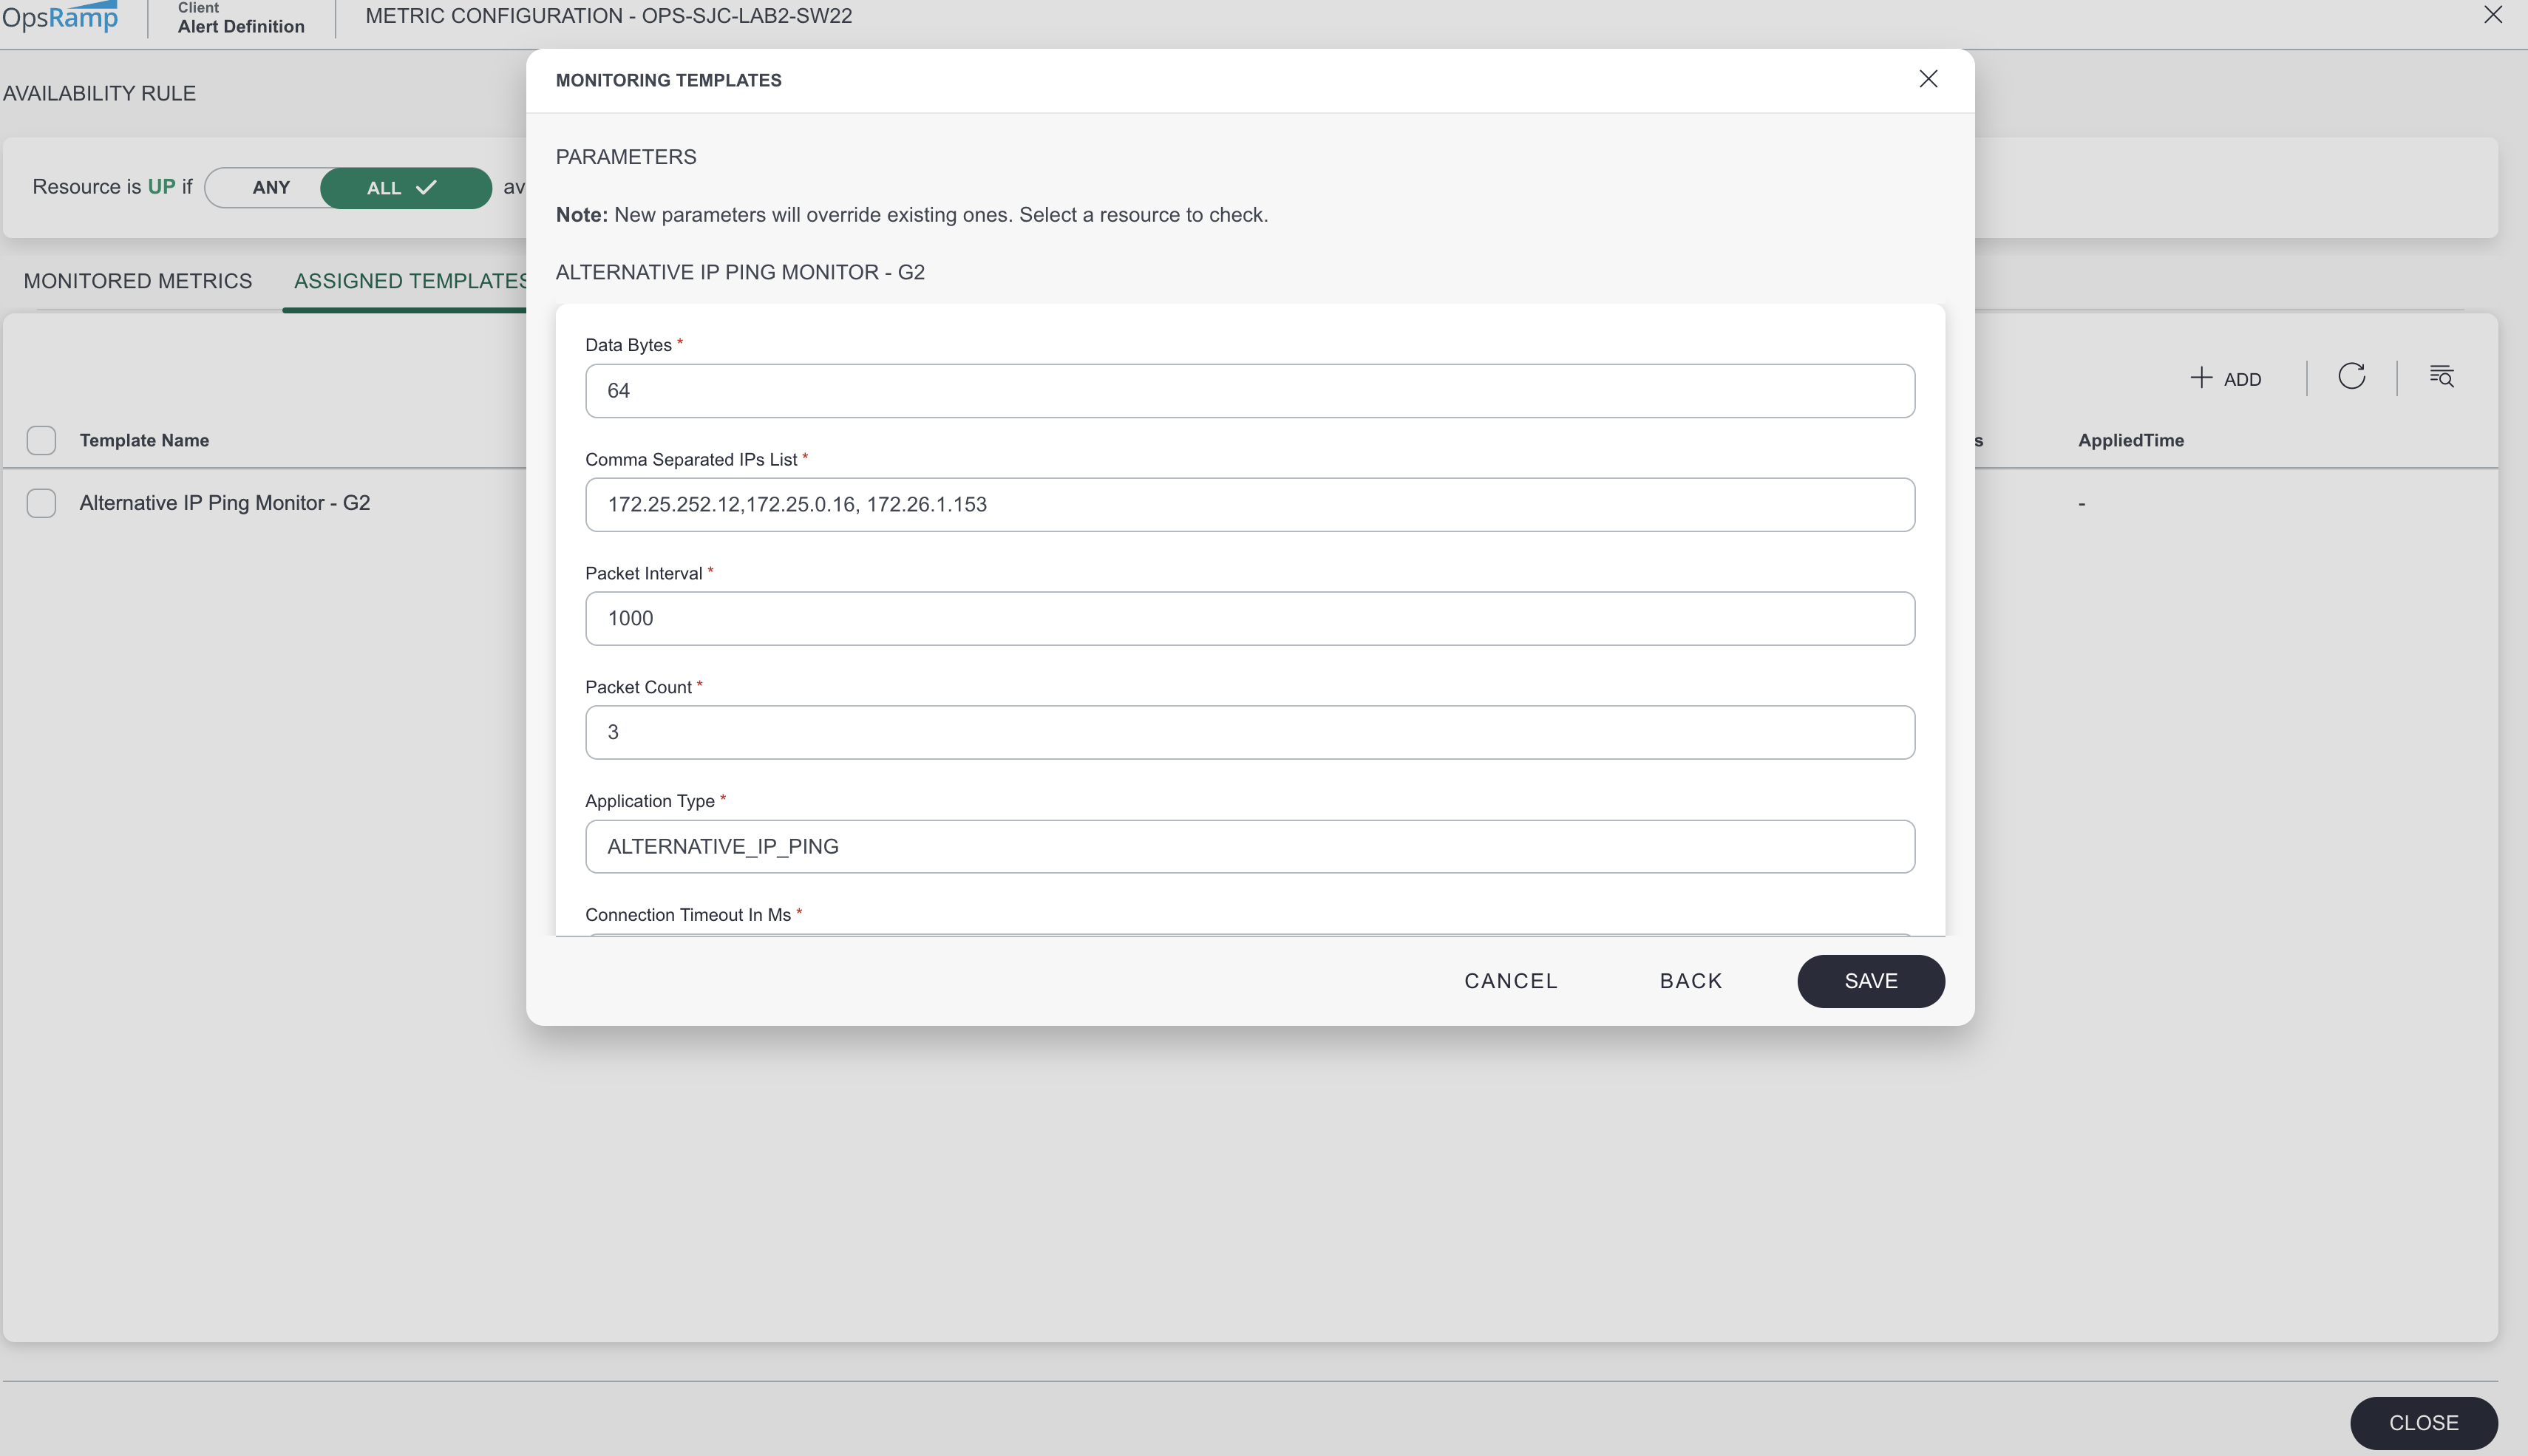
- Click Save to save the configuration parameters and assign the template to the selected device.
Configuration Parameters
| Names | Display Name | Description | Default Value |
|---|---|---|---|
| alternative.ip.ping.reachability.data.bytes | Data Bytes | Size of the ICMP data payload in bytes. Standard value is 64 bytes. | 64 |
| alternative.ip.ping.reachability.pkt.interval | Packet Interval | Interval between consecutive ICMP packets in milliseconds. | 1000 |
| alternative.ip.ping.reachability.pkts.count | Packet Count | Number of ICMP echo request packets to send per monitoring cycle. | 3 |
| alternative.ip.ping.reachability.ip.list | Comma Separated IPs List | Provide a comma-separated list of IPv4 addresses to monitor for each device. Each device can have a different list of alternative IPs. These IPs will be used to check the device's reachability. | NONE |
| collector.application.type | Application Type | It refers to the category or classification of an application based on its purpose, functionality. | ALTERNATIVE_IP_PING |
| connection.timeout.ms | connection timeout in ms | Maximum time in milliseconds to wait for ICMP echo reply. | 15000 |
Get Latest Metric Values
To view the latest metric values:
- From All Clients, select a client.
- Go to Infrastructure > Search.
- From the available resources, select the required resource.
- Select the Metrics tab. Click the View Metrics Configuration icon (slider/settings icon) in the top-right corner. You will be redirected to the Metric Configuration page for the selected device.
- Navigate to the Assigned Templates tab.
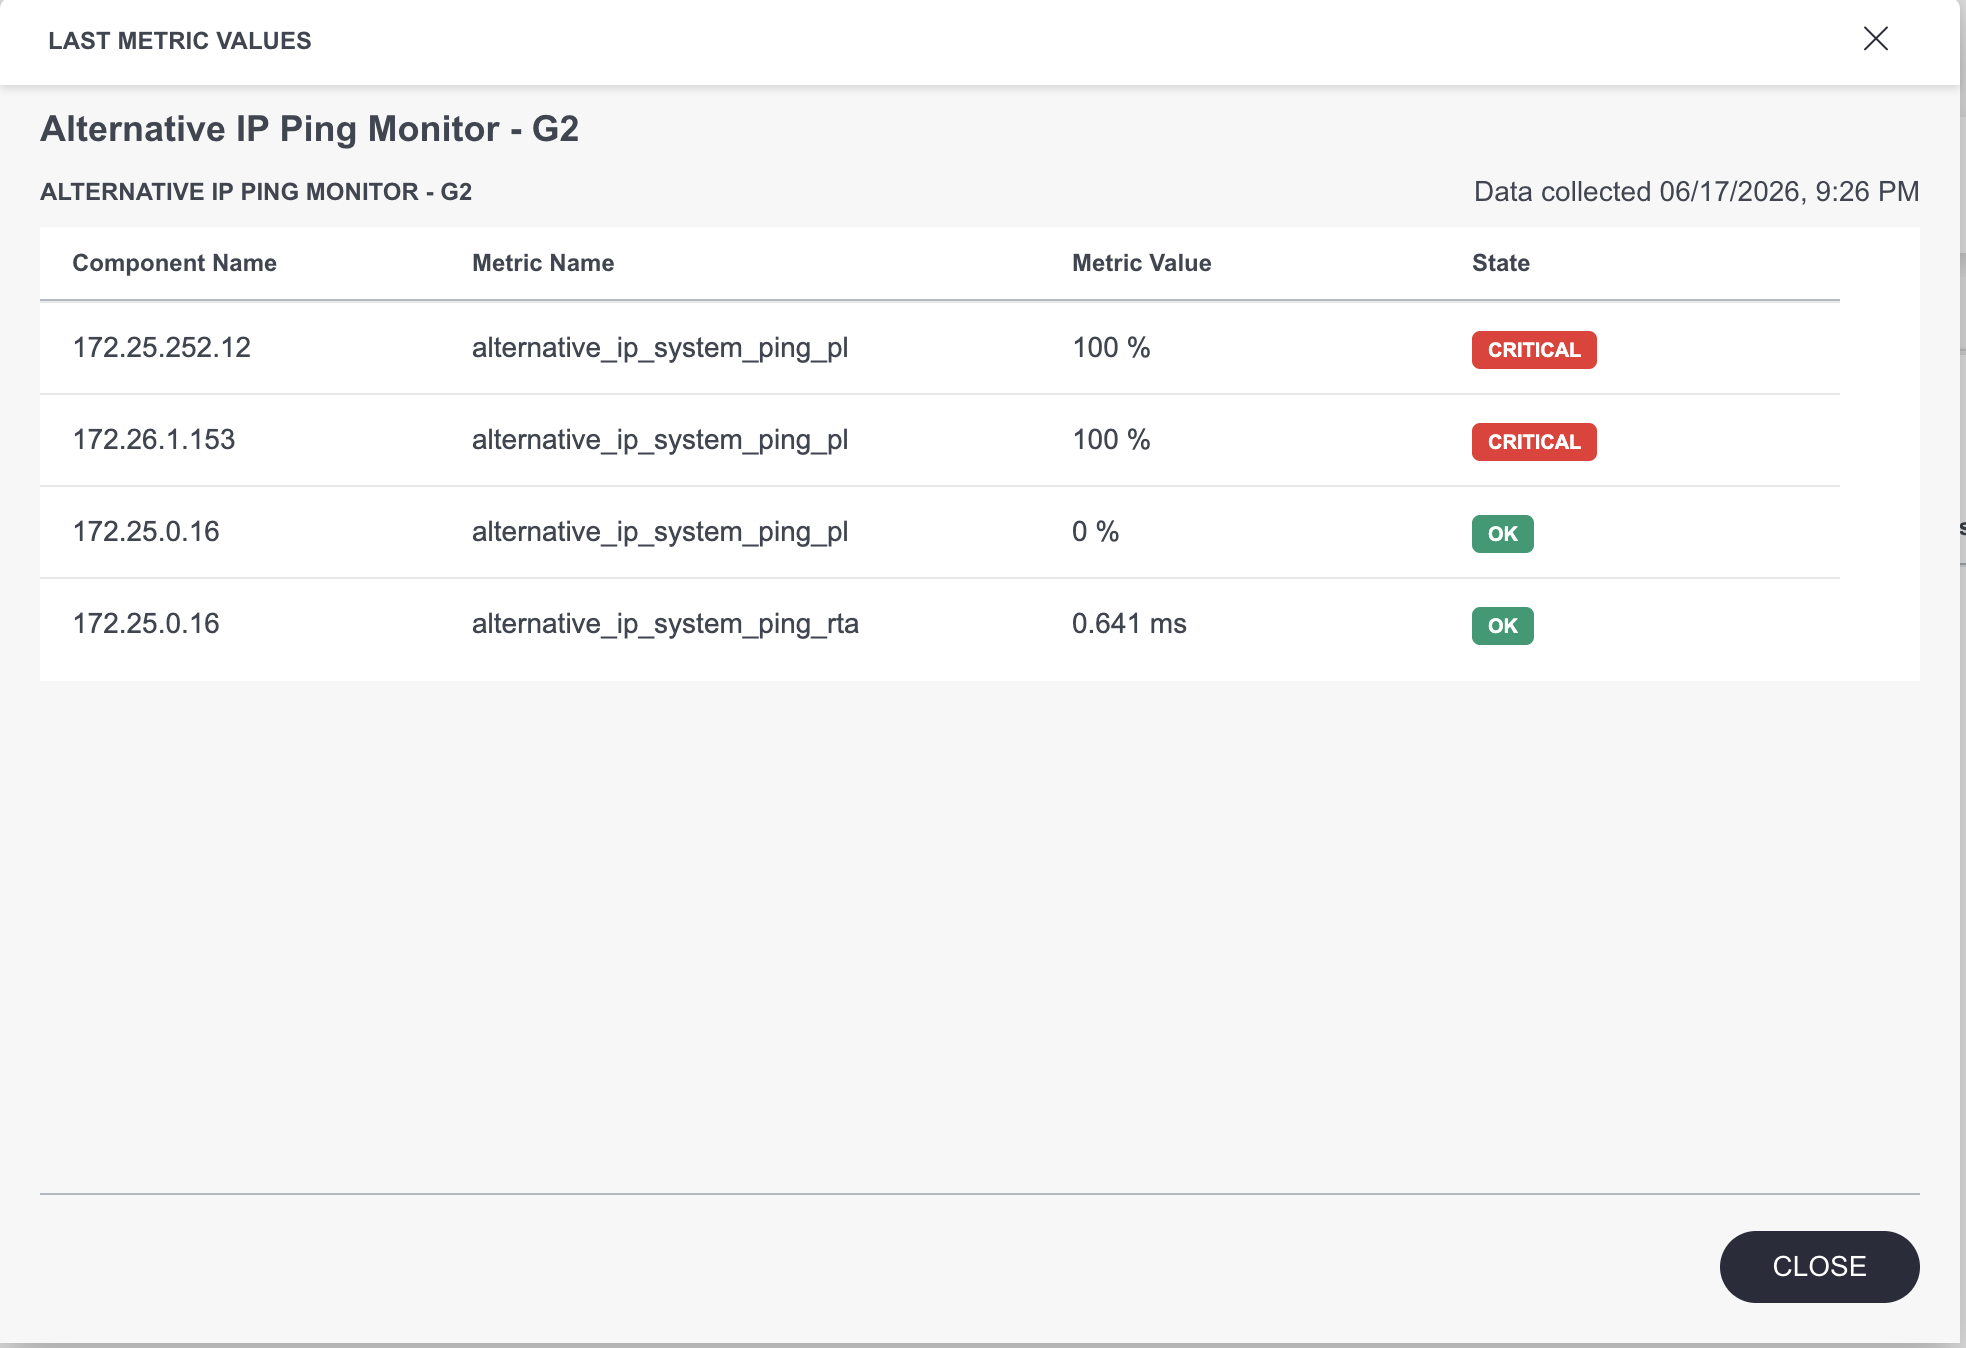
- Locate the required template, click the More Actions (⋮) icon, and select Get Latest Metric Values.
Graphical Metrics Representation
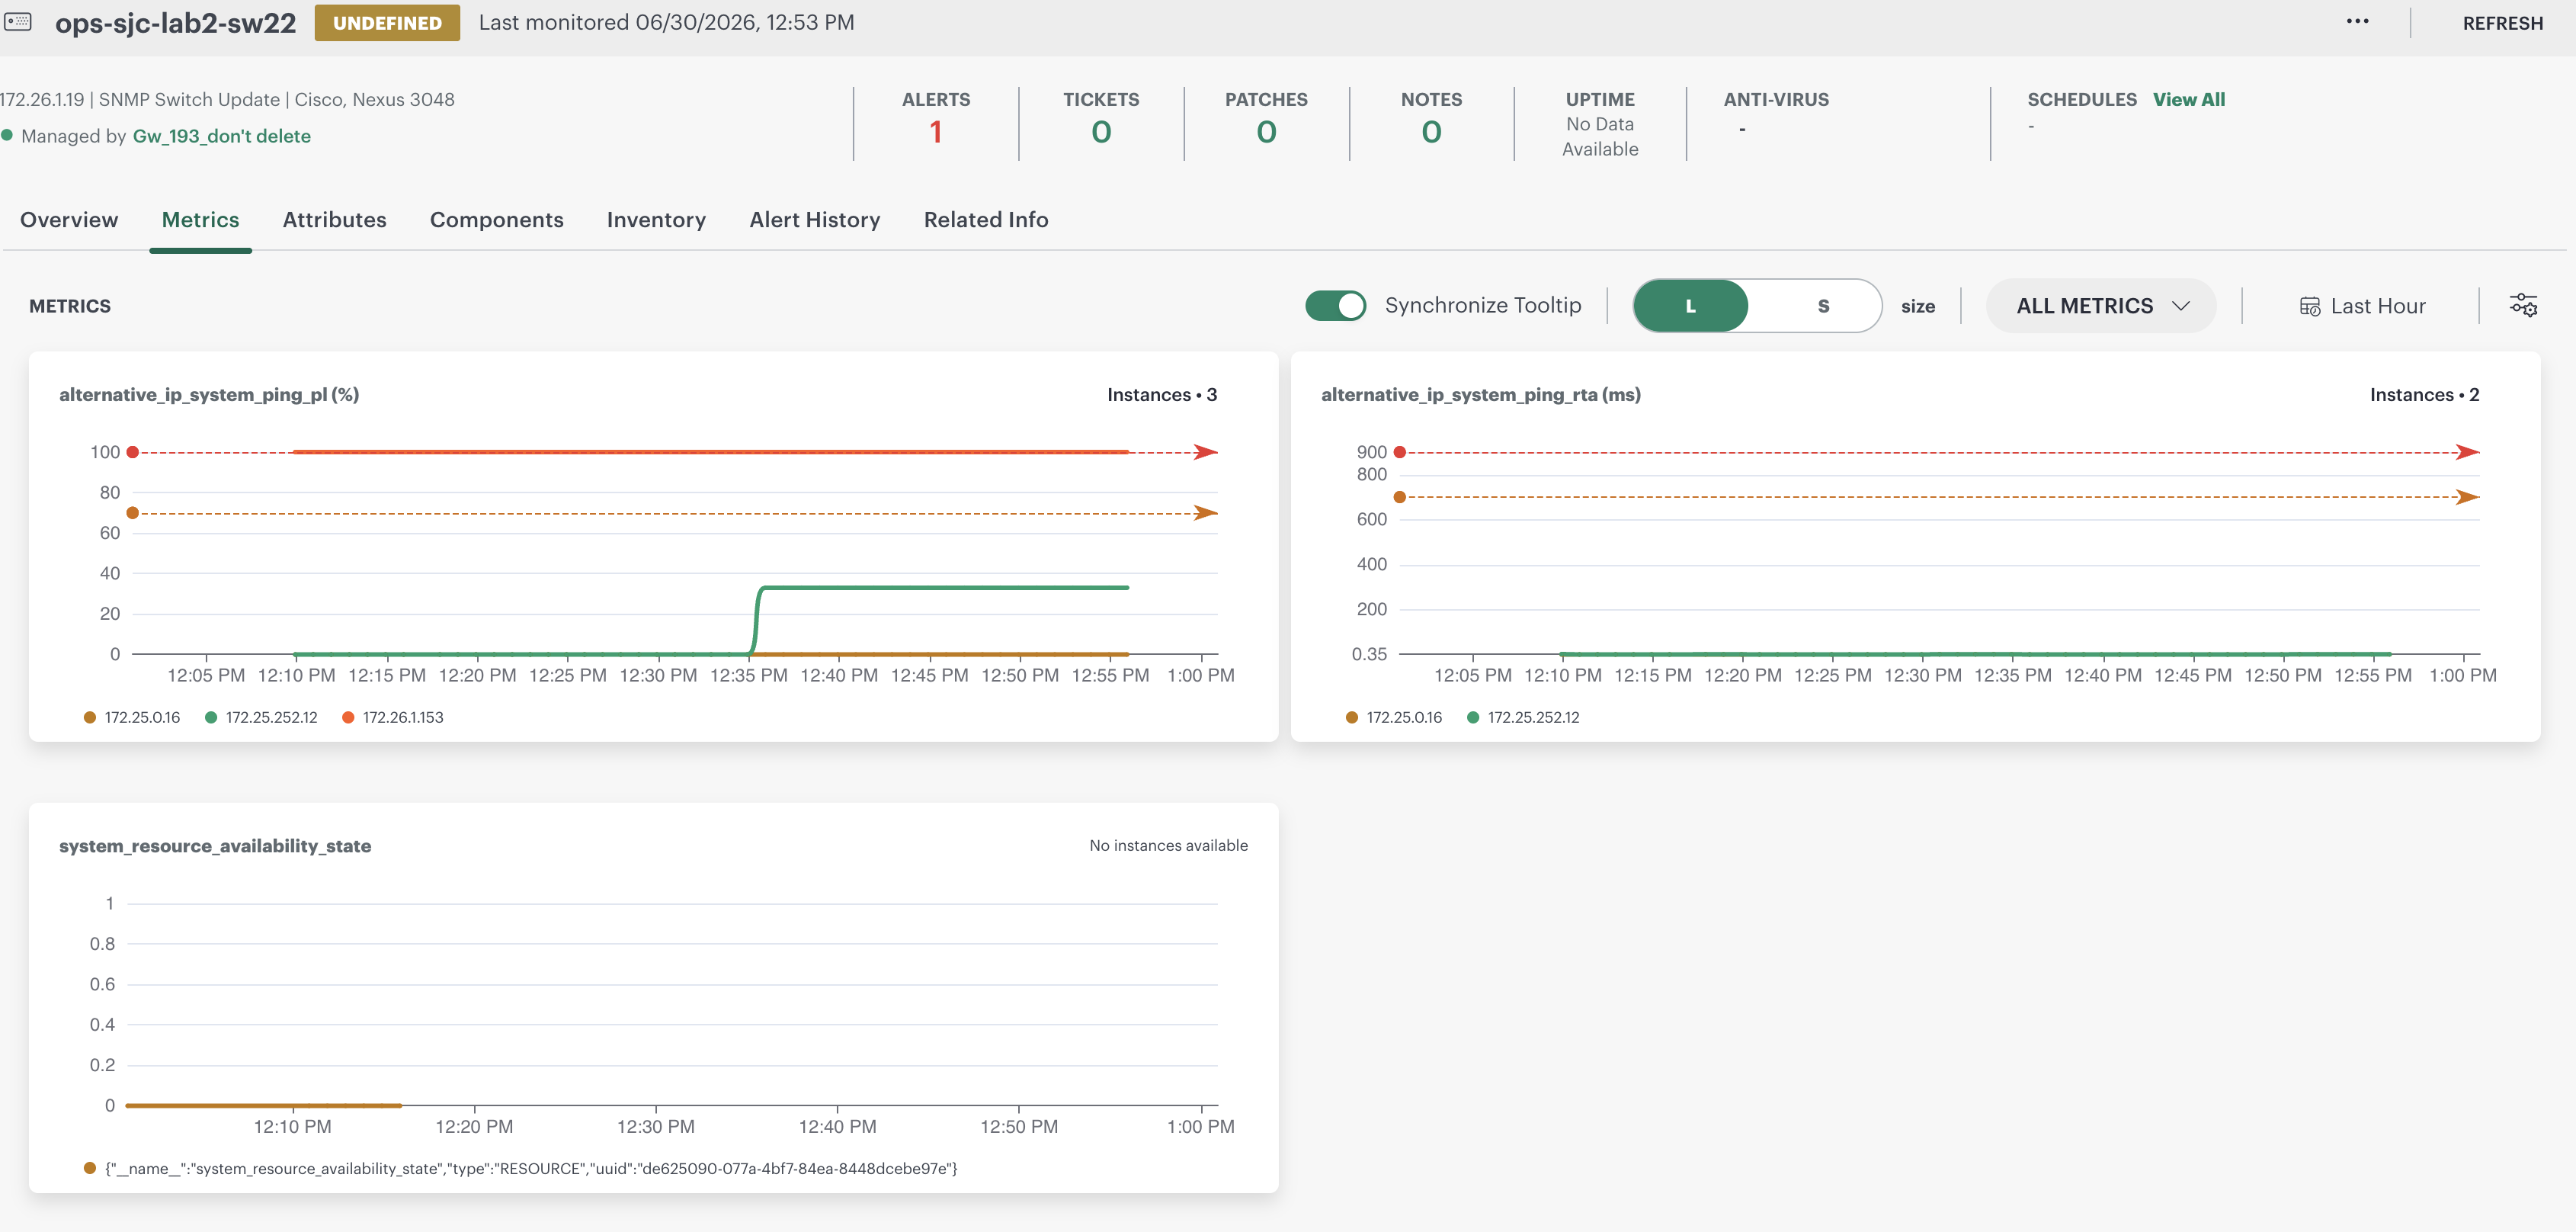
To view metrics in graphical representation:
- From All Clients, select a client.
- Go to Infrastructure > Search.
- From the available resources, select the required resource.
- Select the Metrics tab.
Sample Alert
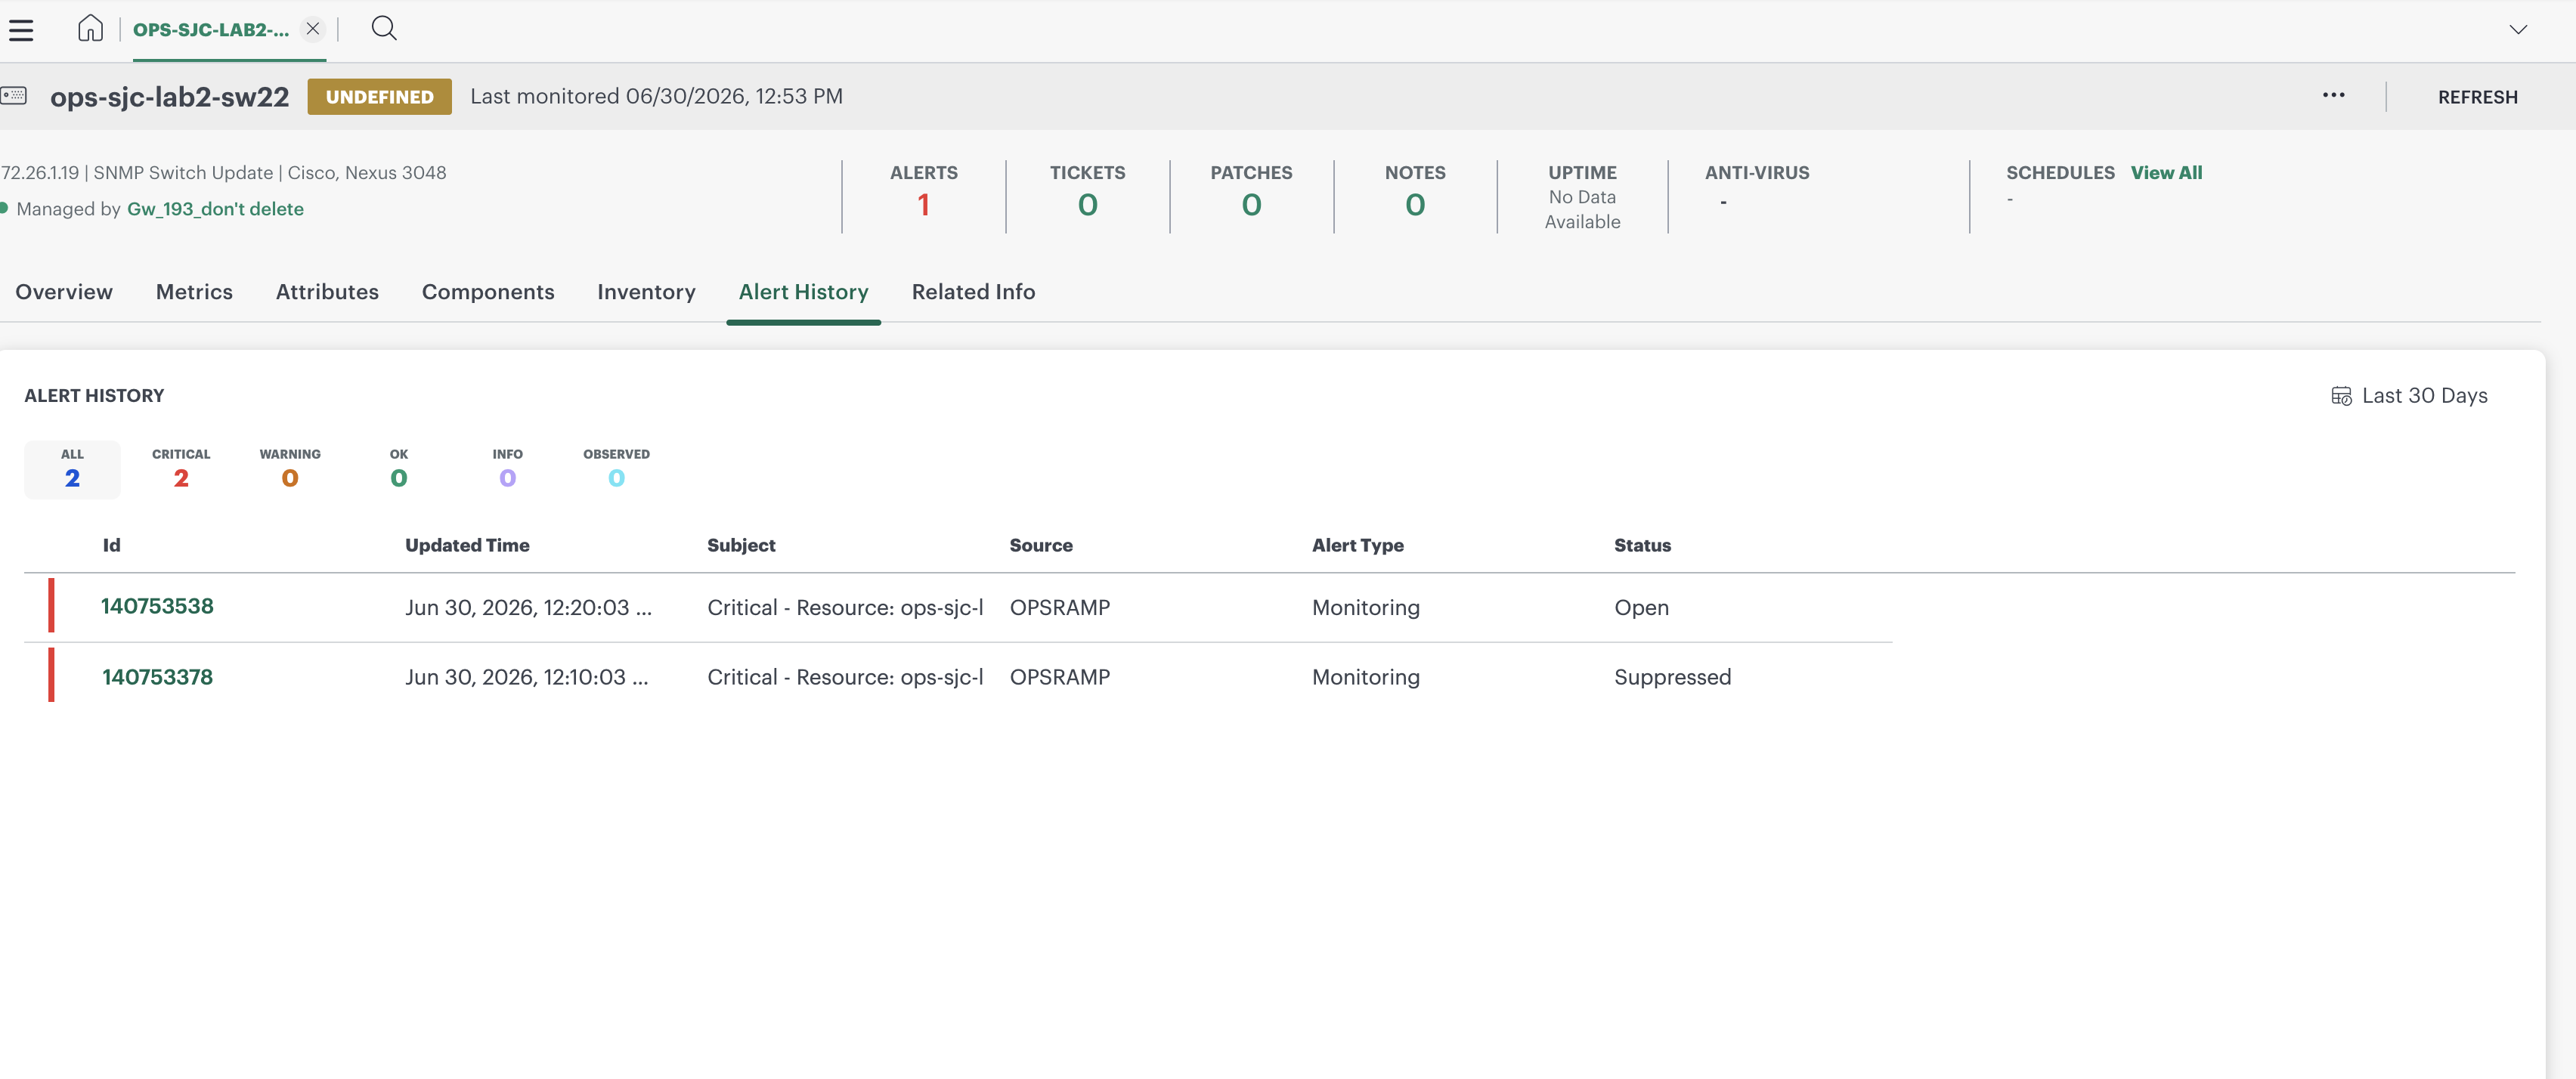
To view alerts:
- From All Clients, select a client.
- Go to Infrastructure > Search.
- From the available resources, select the required resource.
- Navigate to the Alert History tab. All alerts associated with the selected resource are displayed.
Troubleshooting Steps
1. Verify Platform and Gateway Versions
Ensure that the environment meets the minimum supported versions for Alternative IP Ping Monitoring:
- Gateway version: 22.0.0 or later
- Platform version: 2026.07-U1 or later
If either component is running an earlier version, upgrade to a supported version before proceeding with further troubleshooting.
2. Verify Template Assignment
Check whether the Alternative IP Ping template is applied to the device:
- Navigate to Infrastructure > Search.
- Select the required device.
- Open the Metrics tab.
- Click View Monitor Configuration.
- Verify that the Alternative IP Ping template is applied to the device.
3. Verify Reachability of Alternative IPs from the Gateway
Ensure that all configured alternative IP addresses are reachable from the gateway.
Command:
ping <ip_address>
Example:
ping 10.10.1.1
Note
Do not apply duplicate Alternative IP Ping templates to the same device.4. Verify Gateway Time Synchronization
Ensure that the gateway time zone and system time are correctly synchronized. Incorrect time settings can cause delays or loss of metric data.
For example, if the gateway time zone is configured as UTC, the system time must match the current UTC time.
Command to verify the date and time:
date
5. Verify Data Collection Through Gateway Logs
Enable logging on the gateway and verify whether Alternative IP Ping Monitoring requests and responses are being collected.
Accessing GCLI
Classic Gateway
- Log in to the gateway CLI.
- Switch to the root user:
sudo su
- Launch GCLI:
gcli
Next-Gen Gateway
- Log in to the gateway CLI.
- Connect to the vProbe container.
If a namespace is configured:
kubectl exec -it nextgen-gw-0 -c vprobe -n <namespace> -- bash
If no namespace is configured:
kubectl exec -it nextgen-gw-0 -c vprobe -- bash
Note: Replace <namespace> with the appropriate namespace, if applicable.
- Launch GCLI:
gcli
Windows Gateway
- Open Command Prompt (
cmd). - Connect to GCLI:
telnet localhost 11445
Once connected, the GCLI prompt is displayed.
Enable Logging
The following commands are common for Classic, Next-Gen, and Windows Gateways:
flag add alt.ip.ping.log on 30
loglevel set com.vistara.gateway.adapter.alternativeipping.monitor.AlternativeIPPingCollector INFO 20
loglevel set com.vistara.gateway.adapter.alternativeipping.monitor.AlternativeIPPingMonitorExecutor INFO 20
Exit GCLI:
exit
Note
After enabling the logs, wait for one or two monitoring polls to complete. For example, if the template polling frequency is 5 minutes, wait 10–15 minutes before reviewing the logs.Verify Logs
Use the following command to search for monitoring activity in the vProbe logs:
grep 'deviceIp' /var/log/app/vprobe.log
The log output should contain the device IP address along with the corresponding request and response details.